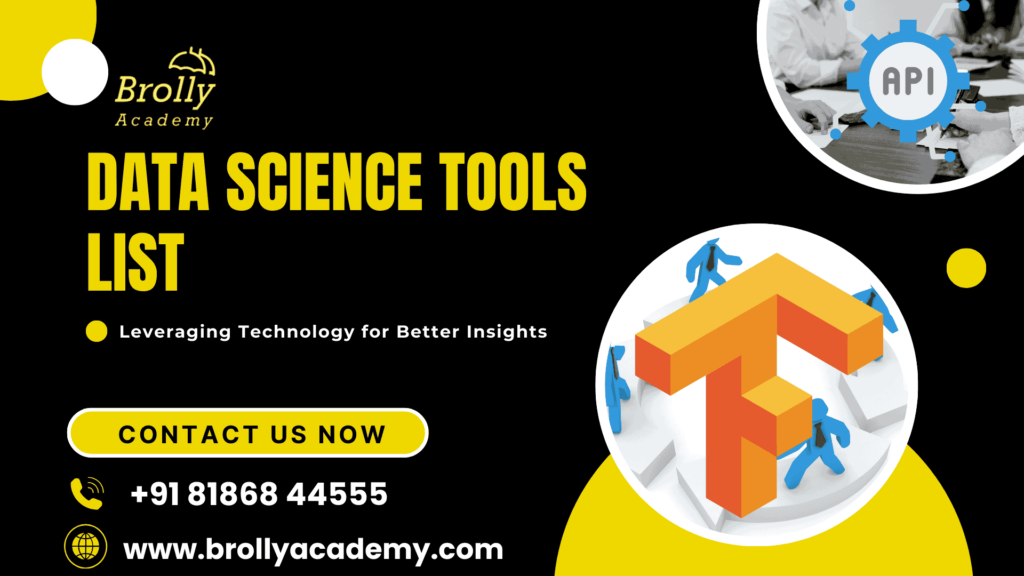
Data Science Tool List
- Data science tools are crucial for converting raw data into valuable insights.
- They play a critical role throughout the data analysis pipeline, supporting various stages of data work.
- These tools help collect, clean, analyze, and visualize data, enabling the development of predictive models and facilitating data-driven decisions.
- Programming Languages: Python and R for data manipulation and analysis.
- Machine Learning Frameworks: TensorFlow, Scikit-learn, and other tools for building models.
- Big Data Processing Tools: Hadoop and Spark for handling massive datasets.
- Data Visualization Tools: Platforms like Tableau and Power BI for creating interactive visualizations and dashboards.
Pandas and NumPy are essential libraries commonly used for handling and manipulating data.Cloud services like AWS, Google Cloud, and Microsoft Azure provide scalable computing power for large data tasks. The right tools enhance a data scientist’s productivity and the overall quality of data analysis results. As the field evolves rapidly, staying familiar with the latest tools is essential to remain competitive and drive innovation in data science.
If you want a detailed PDF with insights on Data Science tools and their applications
👇 to download
1)Python Tool Overview
Key Features of Python Tool
- Ease of Use: Python’s clear and concise syntax makes it beginner-friendly and efficient for development.
- Data Manipulation: Libraries like Pandas and NumPy allow for easy data manipulation, cleaning, and analysis.
- Machine Learning: Python supports machine learning with tools like Scikit-learn, TensorFlow, and PyTorch.
- Data Visualization: Python offers libraries such as Matplotlib and Seaborn for creating rich visualizations to represent data effectively.
- Integration: Python integrates easily with other programming languages, tools, and platforms, enhancing its flexibility.
2)R Tool Overview
Key Features of R Tool
- Statistical Analysis: R excels in statistical computing and provides a wide range of statistical tests and models.
- Data Visualization: Libraries like ggplot2 and plotly allow for advanced and customized data visualizations.
- Extensive Libraries: R has a vast collection of packages for various data science tasks, including dplyr for data manipulation and caret for machine learning.
- Data Handling: R is highly efficient in managing and transforming large datasets, with powerful tools for data wrangling.
- Community and Support: R has a strong community of statisticians and data scientists, providing access to a wealth of tutorials, forums, and resources.
3. SQL Tool Overview
SQL (Structured Query Language) is a specialized language used for managing and manipulating data in relational databases.It is essential for data retrieval, insertion, updating, and deletion in databases. SQL is commonly used in data science for querying and managing large datasets stored in relational databases.
Key Features of SQL Tool
- Data Retrieval: SQL is designed for querying and retrieving data efficiently from large datasets using commands like SELECT.
- Data Manipulation: SQL allows for inserting, updating, and deleting data in a database using INSERT, UPDATE, and DELETE commands.
- Data Filtering and Sorting: SQL provides powerful filtering (WHERE) and sorting (ORDER BY) capabilities to refine query results.
- Joins and Relationships: SQL enables combining data from multiple tables using JOIN operations (INNER JOIN, LEFT JOIN, etc.), which is useful for working with relational data.
- Aggregation and Grouping: SQL supports aggregation functions (SUM, COUNT, AVG) and GROUP BY to summarize and analyze data efficiently.
4. Scala Tool Overview
Key Features of Scala Tool
- Functional and Object-Oriented: Scala supports both functional and object-oriented programming, allowing for a flexible and expressive coding style.
- Big Data Processing: Scala is the primary language used in Apache Spark, making it ideal for processing large datasets in distributed computing environments.
- Concise Syntax: Scala’s syntax is more concise and expressive than Java’s, allowing for fewer lines of code to accomplish complex tasks.
- Interoperability with Java: Scala is fully interoperable with Java, enabling users to leverage the vast array of existing Java libraries and frameworks.
- Immutable Collections: Scala has a strong emphasis on immutability, with built-in support for immutable collections, which is helpful for writing scalable and maintainable code.
5. MATLAB Tool Overview
MATLAB (Matrix Laboratory) is a high-level programming language and environment created for numerical computing, data analysis, and visualization. It is widely used in academia and industry for tasks like signal processing, control systems, image processing, and machine learning due to its powerful computational capabilities.
Key Features of MATLAB Tool:
- Numerical Computing: MATLAB is optimized for mathematical computations, especially matrix and linear algebra operations, making it ideal for numerical analysis.
- Data Visualization: MATLAB offers extensive plotting and visualization capabilities, including 2D and 3D graphs, which are useful for presenting and analyzing data visually.
- Toolboxes: MATLAB provides specialized toolboxes for specific applications, such as signal processing, machine learning, and image processing, allowing users to access pre-built functions and algorithms.
- Simulink Integration: MATLAB integrates with Simulink, a graphical environment for simulation and model-based design, commonly used in engineering and control systems.
- Extensive Libraries: MATLAB has a rich collection of built-in functions and external libraries that support complex mathematical, statistical, and machine learning operations.
6.SAS Tool Overview
SAS (Statistical Analysis System) is a software suite designed for advanced analytics, business intelligence, data management, and predictive analysis. It is particularly well-known in industries such as healthcare, finance, and pharmaceuticals for its robust data analysis capabilities and reliability in handling large datasets.
Key Features of SAS Tool
- Advanced Analytics: SAS provides powerful tools for statistical analysis, predictive modeling, and data mining, allowing users to perform complex analytics on large datasets.
- Data Management: SAS excels in data handling, offering features for data cleaning, transformation, and integration across different sources.
- Reporting and Visualization: SAS includes built-in tools for generating reports and visualizations, helping users present their findings clearly and effectively.
- Strong Support for Regression and Modeling: SAS has comprehensive support for regression analysis, time-series analysis, and other advanced modeling techniques.
- Enterprise-Level Integration: SAS integrates seamlessly with other systems and databases, making it ideal for large enterprises and complex data environments.
7. Java Tool Overview:
Key Features of Java Tool
- Platform Independence: Java programs can run on any platform that supports Java (JVM), allowing for “write once, run anywhere” functionality.
- Object-Oriented Programming: Java’s object-oriented design enables the creation of reusable and modular code, which is ideal for large-scale applications.
- Robust Libraries: Java has a vast set of libraries and frameworks (like Apache Hadoop, Weka) that support data processing, machine learning, and big data analytics.
- Concurrency and Multi-threading: Java’s support for multi-threading and concurrency enables efficient processing of large-scale data and parallel tasks.
- Enterprise-Level Scalability: Java is highly scalable and commonly used for building large, enterprise-level systems, making it suitable for handling big data and complex applications.
8. Go (Golang) Tool Overview:
Go, or Golang, is a compiled programming language with static typing, developed by Google. It is designed for simplicity, efficiency, and scalability, making it particularly well-suited for building high-performance applications, microservices, and handling concurrent tasks. Go is gaining popularity in fields like cloud computing, web development, and data engineering due to its speed and ease of use.
Key Features of Go Tool
- Simplicity and Efficiency: Go’s syntax is simple and easy to learn, enabling fast development while offering high-performance execution.
- Concurrency Support: Go’s built-in concurrency model, using goroutines and channels, allows for efficient parallel processing, making it ideal for handling multiple tasks simultaneously.
- Fast Compilation: Go is known for its fast compilation times, allowing for rapid testing and deployment of applications.
- Memory Management: Go features automatic garbage collection and efficient memory management, ensuring optimal resource usage during application execution.
- Scalability: Go is designed for building scalable systems, making it well-suited for applications that require handling large volumes of data and high concurrency.
9. Swift Tool Overview
Key Features of Swift Tool
- Safety and Reliability: Swift is designed with safety in mind, featuring strong typing and error handling, which helps to prevent common programming mistakes.
- High Performance: Swift is fast, thanks to its compiled nature and optimizations for modern hardware, making it ideal for performance-critical applications.
- Interoperability with Objective-C: Swift is fully interoperable with Objective-C, allowing developers to integrate Swift into existing projects and use legacy code seamlessly.
- Concise Syntax: Swift’s syntax is clean and expressive, enabling developers to write less code and build applications more quickly.
- Dynamic Libraries: Swift supports dynamic libraries, allowing for easier updates and modular code, which improves app performance and development flexibility.
10.TypeScript Tool Overview:
Key Features of TypeScript Tool
- Static Typing: TypeScript allows you to define types for variables, functions, and objects, helping to catch errors at compile time before running the code.
- Compatibility with JavaScript: TypeScript is fully compatible with JavaScript, meaning any existing JavaScript code can be converted into TypeScript and vice versa.
- Improved Developer Tooling: TypeScript provides advanced autocompletion, code navigation, and refactoring tools, enhancing the development experience.
- Object-Oriented Features: TypeScript supports modern object-oriented programming features such as classes, interfaces, and inheritance, which make it more structured than JavaScript.
- Better Code Maintainability: With features like type checking and interfaces, TypeScript improves the maintainability of large and complex codebases, making collaboration and debugging easier.
11. Rust Tool Overview
Key Features of Rust Tool
- Memory Safety: Rust’s ownership system ensures memory safety without the need for a garbage collector, preventing common errors like null pointer dereferencing and buffer overflows.
- Concurrency: Rust provides excellent concurrency support with its message-passing model, enabling developers to write parallel and multi-threaded programs safely.
- High Performance: As a compiled language, Rust provides low-level control over system resources, delivering high performance similar to C and C++.
- Zero-Cost Abstractions: Rust’s abstractions do not incur runtime overhead, allowing for both high-level code and low-level optimizations without sacrificing performance.
- Strong Type System: Rust’s type system prevents many bugs during compile time, ensuring type safety and reducing runtime errors.
12. Perl Tool Overview
Key Features of Perl Tool
- Text Processing: Perl’s regular expression support makes it perfect for pattern matching and data extraction in text-heavy tasks.
- Cross-Platform: Perl is available on major operating systems, including Unix, Linux, Windows, and macOS.
- CPAN Library: The Comprehensive Perl Archive Network provides access to a vast collection of reusable modules for various applications.
- Dynamic Typing: Perl’s dynamic typing system allows flexible and concise code, reducing boilerplate.
- Rapid Prototyping: Perl’s concise syntax and quick script execution enable fast development cycles and testing.
13.Haskell Tool Overview
Key Features of Haskell Tool
- Purely Functional: Haskell follows a purely functional paradigm, where functions are first-class citizens and side effects are minimized.
- Strong Static Type System: Haskell’s type system catches many errors at compile time, ensuring high reliability and reducing runtime errors.
- Lazy Evaluation: Haskell evaluates expressions lazily, meaning values are only computed when needed, improving performance and enabling the creation of infinite data structures.
- Immutability: Haskell emphasizes immutability, which helps avoid side effects and makes programs easier to reason about.
- Concurrency and Parallelism: Haskell supports concurrency and parallelism, allowing developers to build efficient, multi-threaded applications.
14. Shell Scripting (Bash, Zsh) Tool Overview
Key Features of Shell Scripting (Bash, Zsh) Tool
- Automation: Shell scripts automate repetitive tasks like file management, system backups, and software installation.
- Powerful Command-Line Operations: Shells like Bash and Zsh support powerful text processing, file manipulation, and pipeline operations directly from the command line.
- Portability: Scripts written in Bash or Zsh can be run across various Unix-like systems with minimal changes.
- Easy Integration: Shell scripts integrate seamlessly with other programming languages, system commands, and applications, enabling complex workflows.
- Interactive and Customizable: Zsh, in particular, offers powerful customization features, such as auto-completion, syntax highlighting, and enhanced prompt management.
15.Dart Tool Overview
Key Features of Dart Tool
- Cross-Platform Development: Dart enables the creation of applications for multiple platforms, including iOS, Android, web, and desktop, using a single codebase.
- Strong Performance: Dart’s Just-In-Time (JIT) and Ahead-Of-Time (AOT) compilation provide fast execution and efficient performance, especially in mobile apps.
- Rich Standard Library: Dart provides a comprehensive set of libraries for handling everything from UI design to HTTP requests and data processing.
- Easy-to-Learn Syntax: Dart has a clear, simple, and easy-to-understand syntax, making it approachable for developers familiar with JavaScript or other object-oriented languages.
- Integration with Flutter: Dart is the primary language used in Flutter, a UI framework for building fast, natively compiled applications, offering a rich set of pre-built widgets and tools.
16.F# Tool Overview
Key Features of F# Tool
- Functional Programming: F# emphasizes functional programming paradigms, allowing immutability, higher-order functions, and first-class functions to build clean and expressive code.
- Strong Type System: F#’s type inference ensures that many common errors are caught at compile time, providing strong type safety and reducing runtime errors.
- Interoperability: Being part of the .NET ecosystem, F# can easily interoperate with other .NET languages like C# and VB.NET, allowing for easy integration with a wide range of libraries.
- Concise Syntax: F# features a compact and readable syntax, making it ideal for both quick scripting and building large-scale applications.
- Parallel and Asynchronous Programming: F# provides robust support for parallel and asynchronous programming, making it suitable for concurrent applications and computationally intensive tasks.
17.LaTeX Tool Overview
Key Features of LaTeX Tool
- High-Quality Typesetting: LaTeX produces professional-quality documents with precise control over typography, ideal for research papers, books, and presentations.
- Mathematical and Scientific Notation: LaTeX excels in rendering complex mathematical equations and symbols with ease, making it the standard for academic and scientific documentation.
- Bibliography and Citation Management: LaTeX integrates well with citation tools like BibTeX, automating the citation and reference formatting for research papers.
- Document Structure: LaTeX provides a robust framework for organizing large documents with sections, chapters, tables of contents, and indexes.
- Customizability and Extensions: LaTeX is highly customizable and supports numerous packages and extensions for additional functionality, including graphics, tables, and presentations.
18.TensorFlow Tool Overview
Key Features of TensorFlow Tool
- Deep Learning Support: TensorFlow excels in training deep neural networks for complex tasks like image recognition, speech recognition, and text generation.
- Scalability: TensorFlow supports scalable computing across multiple CPUs, GPUs, and even TPUs (Tensor Processing Units), making it suitable for large-scale machine learning tasks.
- Flexible Architecture: TensorFlow allows developers to build custom models and experiment with different architectures using its flexible APIs.
- Ecosystem of Tools: TensorFlow includes tools like TensorFlow Lite (for mobile), TensorFlow.js (for browser-based applications), and TensorFlow Extended (for deploying machine learning pipelines).
- Integration with Other Libraries: TensorFlow integrates seamlessly with other popular libraries such as Keras (for easier neural network building) and TensorFlow Hub (for reusable machine learning modules).
19.PyTorch Tool Overview
Key Features of PyTorch Tool
- Dynamic Computational Graphs: PyTorch uses dynamic computation graphs (eager execution), allowing for flexible model building and debugging, which makes it more intuitive for research and experimentation.
- Strong GPU Acceleration: PyTorch provides seamless GPU support using CUDA, enabling efficient training of large models and speeding up computation.
- Deep Learning Focus: PyTorch is specifically designed for deep learning, offering rich libraries for neural networks, loss functions, optimizers, and more.
- Autograd for Automatic Differentiation: PyTorch’s autograd module automatically computes gradients, making it easier to implement backpropagation for neural network training.
- Integration with Python Libraries: PyTorch integrates well with other popular Python libraries like NumPy and SciPy, making it easy to perform data manipulation and scientific computing alongside deep learning tasks.
20.Keras Tool Overview
Key Features of Keras Tool
- User-Friendly API: Keras provides a high-level, easy-to-use interface that makes building neural networks faster and more intuitive, suitable for both beginners and experts.
- Modular and Extensible: Keras allows the creation of complex architectures by stacking layers and models in a modular fashion, while also being flexible enough to experiment with custom components.
- Support for Multiple Backends: Keras supports multiple backends (like TensorFlow, Theano, and Microsoft Cognitive Toolkit), allowing users to switch between different computation engines.
- Pre-trained Models: Keras offers access to a range of pre-trained models for tasks like image classification and text generation, which can be used for transfer learning or fine-tuning on new data.
- Built-in Support for GPUs: Keras can easily leverage the computational power of GPUs for faster model training and deployment.
21.Apache Spark Tool Overview
Key Features of Apache Spark Tool
- In-Memory Computing: Spark processes data in-memory (RAM), providing significantly faster performance for iterative algorithms compared to disk-based systems.
- Distributed Computing: Spark runs on clusters of computers, distributing tasks across multiple nodes, making it suitable for processing vast amounts of data in parallel.
- Unified Analytics Engine: Spark supports a variety of workloads, including batch processing, real-time streaming, machine learning, and graph processing, all within the same framework.
- Ease of Use: Spark has APIs in Java, Scala, Python, and R, allowing developers to interact with it using the language of their choice. It also provides high-level libraries such as Spark SQL and MLlib for machine learning.
- Fault Tolerance: Spark ensures data integrity and resilience by replicating data across multiple nodes, making it fault-tolerant and reliable for large-scale applications.
22.Hadoop Tool Overview
Key Features of Hadoop Tool
- Scalability: Hadoop can scale from a single server to thousands of machines, allowing it to handle vast amounts of data in a distributed fashion.
- Fault Tolerance: Hadoop replicates data across multiple nodes in the cluster, ensuring that if one node fails, the data is still accessible from another node.
- Cost-Effective: Hadoop uses commodity hardware to build clusters, reducing the cost of scaling and managing large datasets compared to traditional systems.
- Data Locality: Hadoop processes data where it is stored, minimizing data transfer times and improving processing speed by leveraging distributed data storage (HDFS).
- Batch Processing: Hadoop’s MapReduce framework is designed for batch processing, making it suitable for applications that require high-volume data processing over extended periods.
23.D3.js Tool Overview
Key Features of D3.js Tool
- Data Binding: D3.js binds data to DOM elements and updates the visualization in response to changes in the underlying data.
- Customizable Visualizations: D3.js gives complete control over the visualization’s appearance, allowing for the creation of highly customized charts, graphs, and animations.
- Interactive Elements: D3.js supports user interaction features like zooming, panning, and dynamic updates, enhancing the user experience.
- Integration with Web Standards: D3.js uses web standards like HTML, CSS, and SVG, which makes it easy to integrate with other web technologies and ensures cross-browser compatibility.
- Large Ecosystem and Community: D3.js has a large ecosystem of plugins and a vibrant community, offering support and pre-built templates for a wide variety of visualizations.
28.Tableau Tool Overview
Key Features of Tableau
- User-Friendly Interface: Tableau’s drag-and-drop functionality makes it easy for non-technical users to create complex visualizations and interactive dashboards without needing programming skills.
- Data Connectivity: Tableau can connect to a wide range of data sources such as SQL databases, Excel, Google Analytics, cloud services like AWS, and even big data platforms like Hadoop, ensuring flexibility in data integration.
- Interactive Dashboards: Tableau allows users to create highly interactive dashboards where visualizations are linked, allowing for dynamic filtering and drill-down capabilities.
- Real-Time Data Processing: Tableau supports real-time data updates, enabling businesses to make decisions based on the latest information, enhancing agility and responsiveness.
- Advanced Analytics: Tableau includes built-in statistical functions, trend lines, forecasting, and the ability to integrate with R and Python for advan
29. Power BI Tool Overview:
Key Features of Power BI
- User-Friendly Interface: Power BI offers a simple drag-and-drop interface, making it easy for both beginners and advanced users to create reports and dashboards without needing to write complex code.
- Data Connectivity: Power BI supports a wide variety of data sources, including databases, Excel, cloud services like Azure, Salesforce, and Google Analytics, as well as APIs for custom integrations.
- Interactive Visualizations: Users can create interactive and dynamic dashboards where visualizations are linked, allowing users to filter and drill down into the data for deeper insights.
- Real-Time Data: Power BI supports real-time data streaming, so users can monitor their data and make decisions based on the latest information, crucial for fast-moving business environments.
- Advanced Analytics and AI: Power BI integrates with Azure Machine Learning and provides features like natural language queries (Q&A), advanced statistical functions, and AI-driven insights, enhancing its analytical capabilities.
30. QlikView Tool Overview
Key Features of QlikView
- Associative Data Model: QlikView’s unique associative model allows users to explore data from different angles by selecting and linking data points dynamically, leading to more insightful analysis.
- Interactive Dashboards: It offers intuitive and interactive dashboards that users can customize to their specific needs, with features like drill-downs and filtering for deep data exploration.
- Data Integration: QlikView can connect to a wide variety of data sources, including databases, spreadsheets, and cloud services, providing a unified view of the data.
- Self-Service BI: Users can create their own reports and visualizations without relying on IT, empowering business users with greater control over their data analysis.
- Advanced Analytics: QlikView offers built-in advanced analytics capabilities, allowing for more complex calculations and data exploration, as well as integration with external analytics tools.
Master Essential Data Science Tool List at Brolly Academy and Shape Your Future in Data

31.Excel Tool Overview
Key Features of Excel
- Data Organization and Analysis: Excel allows users to organize data in tables, perform calculations, and analyze data using formulas, pivot tables, and charts.
- Data Visualization: Excel offers a variety of built-in charts and graphs, such as bar charts, pie charts, and line graphs, to visualize data trends and insights.
- Advanced Formulas and Functions: Excel provides a wide range of functions for statistical analysis, financial modeling, and mathematical calculations, helping users analyze data efficiently.
- Pivot Tables and Pivot Charts: Pivot tables allow users to summarize, filter, and group data dynamically, while pivot charts help visualize the summarized data.
- Integration with Other Tools: Excel can integrate with a wide range of data sources, such as databases, cloud services, and other Microsoft applications like Power BI and SharePoint, for advanced analysis and reporting.
32.Jupyter Notebooks Tool Overview
Key Features of Jupyter Notebooks
- Interactive Code Execution: Jupyter Notebooks supports interactive coding with immediate feedback, allowing users to run code and see results step by step.
- Support for Multiple Languages: While initially designed for Python, Jupyter supports multiple programming languages, such as R, Julia, and Scala, through its kernel system.
- Rich Text and Visualizations: Users can embed Markdown text, LaTeX equations, and visualizations (e.g., using Matplotlib or Plotly), making it easy to document code and present findings.
- Reproducible Research: Jupyter Notebooks allow for the creation of reproducible workflows, where both the code and the results are captured together, ensuring consistency in research and analysis.
- Extensibility and Integrations: Jupyter supports various plugins and integrates well with tools like GitHub, cloud services, and databases, enhancing collaboration and data sharing.
33.Google Colab Tool Overview
Key Features of Google Colab
- Cloud-Based and Free GPU/TPU: Google Colab provides access to free GPU and TPU hardware for fast computation, making it ideal for training machine learning models or running intensive computations.
- Collaborative Environment: Google Colab allows multiple users to collaborate in real-time, similar to Google Docs, making it easy for teams to work together on notebooks.
- Easy Sharing and Integration with Google Drive: Colab notebooks are saved directly to Google Drive, allowing for seamless sharing, version control, and integration with other Google services.
- Supports Python and Popular Libraries: Colab supports Python and includes many popular libraries (like TensorFlow, Keras, and Pandas) pre-installed, saving time on setup.
- Interactive Visualizations: Just like Jupyter, Colab supports embedding visualizations (e.g., Matplotlib, Plotly), interactive widgets, and LaTeX, making it suitable for detailed data analysis and presentations.
34.KNIME Tool Overview
Key Features of KNIME
- Graphical Workflow Design: KNIME offers a drag-and-drop interface, enabling users to build data workflows by connecting various pre-built nodes for data processing, analysis, and modeling.
- Integration with Multiple Data Sources: KNIME supports a wide range of data sources including databases, spreadsheets, and big data platforms, and integrates well with various data science tools and libraries.
- Machine Learning and Analytics: KNIME has extensive built-in support for machine learning algorithms, data mining, statistical analysis, and data visualization, making it a comprehensive tool for data analysis.
- Extensibility with Plugins: KNIME’s ecosystem includes various plugins that extend its functionality, such as integration with Python, R, and Hadoop, and additional advanced algorithms.
- Collaboration and Sharing: KNIME allows users to share workflows and results with other users via the KNIME Hub, and it supports team collaboration on data science projects.
35.RapidMiner Tool Overview
Key Features of RapidMiner
- Visual Workflow Design: RapidMiner offers an intuitive, drag-and-drop interface for building machine learning models and data pipelines, allowing users to design workflows without coding.
- Pre-built Algorithms: RapidMiner includes a wide range of pre-built machine learning algorithms and data processing operators, which make it easy to build predictive models and perform data transformations.
- Automated Machine Learning (AutoML): The platform offers AutoML functionality that automates the process of selecting the best machine learning models and tuning hyperparameters, simplifying the model-building process.
- Extensive Data Connectivity: RapidMiner supports various data sources, including databases, flat files, cloud storage, and big data platforms, enabling easy data integration.
- Collaboration and Deployment: RapidMiner offers features for team collaboration, workflow sharing, and model deployment, making it suitable for both individual users and enterprise teams working on large-scale projects.
36.Alteryx Tool Overview
Key Features of Alteryx
- Data Preparation and Blending: Alteryx excels in automating and simplifying data preparation and blending tasks, enabling users to merge, clean, and transform data from different sources.
- Drag-and-Drop Interface: Alteryx features a user-friendly, code-free workflow design, allowing users to create complex analytics processes without writing any code.
- Advanced Analytics: The platform provides advanced analytics capabilities, including predictive modeling, geospatial analysis, and time-series forecasting, using both built-in tools and integration with R and Python.
- Data Connectivity: Alteryx supports integration with a variety of data sources, such as databases, cloud services, spreadsheets, and big data platforms, for seamless data access and analysis.
- Automation and Sharing: Alteryx allows users to automate workflows, schedule tasks, and share results with other team members or stakeholders through reports and dashboards.
37.DataRobot Tool Overview:
Key Features of DataRobot
- Automated Machine Learning (AutoML): DataRobot automates the process of building machine learning models, from data preprocessing to hyperparameter tuning, allowing users to quickly generate high-performance models.
- Wide Range of Algorithms: DataRobot supports a large variety of machine learning algorithms, including decision trees, random forests, gradient boosting, neural networks, and more, giving users flexibility in model selection.
- Model Interpretability: DataRobot provides tools for model interpretability, enabling users to understand how models make predictions and assess feature importance, which is crucial for business decision-making.
- End-to-End Machine Learning Lifecycle: The platform supports the entire machine learning workflow, including data preparation, model development, deployment, and monitoring, making it a complete solution for AI projects.
- Scalable Deployment: DataRobot allows users to deploy machine learning models into production environments seamlessly and monitor their performance over time.
38. Apache Flink Tool Overview
Key Features of Apache Flink
- Real-Time Stream Processing: Flink is built for processing real-time data streams with low latency and high throughput, making it ideal for use cases like real-time analytics, monitoring, and event-driven applications.
- Fault Tolerance and Scalability: Flink offers built-in fault tolerance using state snapshots, enabling the recovery of data streams in case of failure. It can scale horizontally to handle large datasets and high volumes of events.
- Unified Batch and Stream Processing: Flink supports both stream and batch processing within the same framework, offering flexibility for handling different types of data processing workflows.
- Event Time Processing: Flink supports event time processing, which allows for more accurate handling of events based on their timestamps rather than the time they are processed.
- Advanced Windowing and CEP: Flink provides powerful windowing and complex event processing (CEP) capabilities to handle data flows and detect patterns within streams, which is crucial for advanced analytics.
39.Caffe Tool Overview
Key Features of Caffe
- High Performance: Caffe is optimized for speed and performance, allowing users to train deep learning models efficiently, especially on GPUs.
- Modular Architecture: The framework provides a modular architecture with predefined layers, making it easy for users to build and customize deep learning models, especially CNNs.
- Pre-trained Models: Caffe offers access to a variety of pre-trained models (such as image classification models), which can be fine-tuned for specific tasks or used directly for inference.
- Cross-Platform: Caffe can be deployed on different platforms, including Linux, macOS, and Windows, and it supports GPU acceleration, making it suitable for both research and production environments.
- Flexible Deployment: Caffe can be integrated into a wide range of applications and supports deployment on mobile devices, embedded systems, and cloud platforms for real-time use.
40.BigML Tool Overview
Key Features of BigML
- Automated Machine Learning (AutoML): BigML offers a streamlined, automated process for building and tuning machine learning models, making it easier for users to create models without deep technical knowledge.
- Wide Range of Models: The platform supports a variety of machine learning models, including decision trees, ensembles, regression models, clustering, anomaly detection, and deep learning models.
- Data Integration: BigML supports integration with various data sources, such as CSV files, databases, and cloud storage platforms, for easy data upload and model building.
- Visualization and Interpretation: BigML provides interactive visualizations to help users interpret model results, including feature importance and decision boundaries, making it easier to understand model behavior.
- Scalable Deployment: BigML allows users to deploy models directly to the cloud and provides APIs for integrating machine learning models into production applications.
Learn the Top Data Science Tool List at Brolly Academy and Build a Future in Data!
41.Orange Tool Overview
Key Features of Orange
- Visual Workflow Design: Orange provides a visual programming interface that allows users to build data analysis workflows by dragging and dropping components, such as data importers, classifiers, and visualizations.
- Wide Range of Widgets: Orange includes numerous pre-built widgets for data preprocessing, visualization, and machine learning algorithms, making it easy to perform tasks like classification, clustering, and regression.
- Extensibility: Orange allows users to extend its functionality by integrating custom Python code, enabling users to run more advanced machine learning models and analysis techniques.
- Real-Time Visualization: Orange offers powerful visualization tools to interactively explore data and model results, such as scatter plots, box plots, and ROC curves.
- Educational Focus: Orange is often used in educational settings due to its simple interface and its ability to visually demonstrate the workings of machine learning algorithms.
42.Microsoft HDInsight Tool Overview
Key Features of Microsoft HDInsight
- Big Data Framework Support: HDInsight supports popular big data frameworks such as Apache Hadoop, Spark, HBase, and Hive, making it easy to process large-scale data with familiar tools.
- Scalability: HDInsight is designed to scale dynamically, allowing users to add or remove resources depending on the processing power and storage needs of the workloads.
- Integration with Azure Ecosystem: It integrates seamlessly with other Azure services like Azure Storage, Azure Data Lake, and Azure Machine Learning, creating a unified data processing environment.
- Managed Service: HDInsight is fully managed, reducing the operational overhead of managing a big data cluster. Users can focus on analytics and data processing, while Azure handles provisioning, monitoring, and maintenance.
- Security and Compliance: HDInsight provides built-in security features, such as enterprise-grade encryption, access controls, and compliance with major industry standards, making it suitable for enterprise-level data processing.
43.AWS SageMaker Tool Overview
Key Features of AWS SageMaker
- Comprehensive ML Lifecycle Management: SageMaker supports the entire machine learning lifecycle, from data preparation, model building, and training to deployment, monitoring, and model management.
- Built-in Algorithms and Frameworks: SageMaker offers a wide range of built-in machine learning algorithms and supports popular deep learning frameworks like TensorFlow, PyTorch, and MXNet, as well as custom algorithm integration.
- Automated Machine Learning (AutoML): SageMaker includes AutoML features through tools like SageMaker Autopilot, which automatically selects the best algorithm and optimizes hyperparameters for machine learning tasks.
- Scalability and Flexibility: SageMaker provides on-demand compute resources, allowing users to scale training and inference tasks with minimal effort. It also supports distributed training for large datasets.
- Seamless Integration with AWS Services: SageMaker integrates with a wide variety of AWS services, such as S3 for storage, Lambda for serverless execution, and IAM for access control, creating a comprehensive machine learning ecosystem.
44.Google BigQuery Tool Overview
Key Features of Google BigQuery
- Serverless Architecture: BigQuery is fully managed, eliminating the need for users to manage infrastructure or worry about provisioning resources for data storage or querying.
- Scalable and High-Performance: It can handle vast amounts of data and complex queries, scaling automatically to meet the needs of large datasets without sacrificing performance.
- Real-Time Analytics: BigQuery supports real-time analytics, allowing users to process and query data as it is ingested into the platform.
- Built-in Machine Learning: BigQuery integrates with Google Cloud AI tools and provides native support for machine learning models through BigQuery ML, enabling users to train and deploy models directly in SQL.
- Integration with Google Cloud Ecosystem: BigQuery integrates seamlessly with other Google Cloud services, such as Google Cloud Storage, Dataflow, and Data Studio, making it part of a comprehensive cloud data analytics ecosystem.
45.IBM Watson Studio Tool Overview:
Key Features of IBM Watson Studio
- Comprehensive Data Science Tools: Watson Studio provides a wide range of tools for data preparation, exploration, model building, and deployment, supporting popular languages and frameworks such as Python, R, TensorFlow, and PyTorch.
- Collaboration and Version Control: The platform facilitates collaboration among team members by enabling shared workspaces, version control, and project management tools.
- Automated Machine Learning (AutoML): Watson Studio includes AutoAI, an automated machine learning tool that simplifies model creation by automatically selecting algorithms, preprocessing steps, and hyperparameters.
- Integration with IBM Cloud and Third-Party Tools: Watson Studio integrates seamlessly with IBM Cloud services and external platforms, allowing for scalable computing and data storage, as well as integration with other machine learning libraries.
- Data Security and Governance: The platform offers enterprise-grade security features, including data encryption, access control, and compliance with industry standards, making it suitable for regulated industries.
Master the top Data Science Tool List with Brolly Academy – Your Path to Data-Driven Success
46.Matplotlib Tool Overview
Key Features of Matplotlib
- Wide Range of Plots: Matplotlib supports various types of plots, including line, bar, scatter, pie, histogram, and more, making it a versatile tool for visualizing data in different formats.
- Customizable Visualizations: Users can control every aspect of the plot, from colors and labels to axes and grids, enabling the creation of highly customized visualizations for different purposes.
- Integration with Other Libraries: Matplotlib integrates seamlessly with other Python libraries such as NumPy, Pandas, and SciPy, making it ideal for use in data science and machine learning workflows.
- Publication-Quality Graphics: Matplotlib allows users to create high-quality visualizations suitable for scientific papers, presentations, and reports, with options for exporting images in various formats like PNG, PDF, and SVG.
- Interactivity: Matplotlib offers basic interactive features like zooming, panning, and tooltips, and can also be used with interactive environments like Jupyter Notebooks.
47.Seaborn Tool Overview
Key Features of Seaborn
- Statistical Plots: Seaborn is tailored for statistical data visualization, making it easy to generate complex plots like regression plots, box plots, and violin plots with minimal code.
- Simplified Syntax: Seaborn’s high-level API simplifies the process of creating complex visualizations. Users can easily generate plots with a few lines of code, making it more accessible to beginners.
- Aesthetic Themes: Seaborn comes with built-in themes and color palettes that enhance the aesthetic quality of visualizations, making it easy to create visually appealing charts.
- Integration with Pandas: Seaborn works seamlessly with Pandas DataFrames, allowing for efficient handling of data and automatic detection of data types when generating plots.
- Complex Plotting Capabilities: Seaborn simplifies the creation of multi-plot grids, categorical plots, and statistical visualizations, which would typically require more complex code in Matplotlib.
48.Matplotlib Tool Overview
Key Features of Matplotlib
- Wide Range of Plots: Matplotlib supports various types of plots, including line, bar, scatter, pie, histogram, and more, making it a versatile tool for visualizing data in different formats.
- Customizable Visualizations: Users can control every aspect of the plot, from colors and labels to axes and grids, enabling the creation of highly customized visualizations for different purposes.
- Integration with Other Libraries: Matplotlib integrates seamlessly with other Python libraries such as NumPy, Pandas, and SciPy, making it ideal for use in data science and machine learning workflows.
- Publication-Quality Graphics: Matplotlib allows users to create high-quality visualizations suitable for scientific papers, presentations, and reports, with options for exporting images in various formats like PNG, PDF, and SVG.
- Interactivity: Matplotlib offers basic interactive features like zooming, panning, and tooltips, and can also be used with interactive environments like Jupyter Notebooks.
49.Seaborn Tool Overview:
Key Features of Seaborn
- Statistical Plots: Seaborn is tailored for statistical data visualization, making it easy to generate complex plots like regression plots, box plots, and violin plots with minimal code.
- Simplified Syntax: Seaborn’s high-level API simplifies the process of creating complex visualizations. Users can easily generate plots with a few lines of code, making it more accessible to beginners.
- Aesthetic Themes: Seaborn comes with built-in themes and color palettes that enhance the aesthetic quality of visualizations, making it easy to create visually appealing charts.
- Integration with Pandas: Seaborn works seamlessly with Pandas DataFrames, allowing for efficient handling of data and automatic detection of data types when generating plots.
- Complex Plotting Capabilities: Seaborn simplifies the creation of multi-plot grids, categorical plots, and statistical visualizations, which would typically require more complex code in Matplotlib.
50.Plotly Tool Overview
Key Features of Plotly
- Interactive Visualizations: Plotly excels in creating interactive charts that allow users to explore data through zooming, panning, and hovering over data points.
- Wide Range of Charts: It supports various chart types, including scatter plots, bar charts, line charts, heatmaps, 3D charts, and financial charts, making it versatile for many use cases.
- Dashboards and Web Integration: Plotly integrates with Dash (its web framework) to create interactive, data-driven dashboards, which can be shared and embedded in websites.
- Multiple Programming Language Support: Plotly works seamlessly with Python, R, MATLAB, and JavaScript, making it highly accessible across different programming environments.
- Customization: The library offers extensive customization options, allowing users to modify every aspect of a plot, including colors, layout, titles, and axis formatting.
51.ggplot2 Tool Overview
Key Features of ggplot2
- Layered Visualization: ggplot2 follows a layered approach, allowing users to build visualizations step by step by adding different elements like data, aesthetics, geometries, and statistical transformations.
- Elegant and Intuitive Syntax: The syntax in ggplot2 is clean and concise, making it easy to add layers for different components (like points, lines, or text) in the plot.
- Customizable and High-Quality: ggplot2 allows users to create publication-quality visualizations with fine control over every detail, such as titles, axis labels, colors, and themes.
- Integration with R’s Tidyverse: ggplot2 integrates seamlessly with the Tidyverse suite of R packages, allowing easy manipulation of data and integration with other visualization tools.
- Wide Range of Plot Types: ggplot2 supports a variety of plot types, including scatter plots, bar plots, histograms, box plots, and more, with advanced options for facetting and combining plots.
52.Leaflet Tool Overview
Key Features of Leaflet
- Interactive Maps: Leaflet allows the creation of highly interactive maps, supporting zooming, panning, and click events to interact with map elements.
- Lightweight and Fast: Leaflet is designed to be fast and lightweight, providing good performance even with large amounts of data or complex maps.
- Extensive Plugin Ecosystem: The library has a wide range of plugins available for additional functionality, such as heatmaps, choropleth maps, clustering, and routing.
- Cross-Browser Compatibility: Leaflet works across all major browsers and is fully responsive, ensuring maps look good on both desktops and mobile devices.
- Integration with External Data: Leaflet can integrate with different geospatial data sources like GeoJSON, KML, and tile services, making it versatile for various mapping applications.
53.Altair Tool Overview
Key Features of Altair
- Declarative Syntax: Altair uses a declarative approach to visualizations, where users describe the plot and the library handles the layout, making it intuitive and concise.
- Interactive Visualizations: Altair supports the creation of interactive charts, such as those that include hover effects, zooming, and filtering.
- Integration with Pandas: Altair integrates seamlessly with Pandas DataFrames, allowing users to quickly visualize data from dataframes in a straightforward way.
- High-Quality Visualizations: Altair is designed to produce clean, beautiful, and publication-ready visualizations by default, making it ideal for creating professional reports and presentations.
- Easy Customization: Altair provides a high degree of flexibility for customizing visualizations, including axes, colors, labels, and legends, with relatively little code.
54.Bokeh Tool Overview
Key Features of Bokeh
- Interactive Visualizations: Bokeh enables the creation of highly interactive visualizations with tools like zoom, pan, hover, and more, enhancing the user experience.
- Wide Range of Plot Types: Bokeh supports various types of plots, including line charts, scatter plots, bar charts, heatmaps, geographic maps, and more, with customization options.
- Web Integration: It is easy to integrate Bokeh visualizations into web applications and dashboards, thanks to its support for embedding plots in HTML, integrating with web frameworks like Flask and Django.
- Large Dataset Handling: Bokeh is optimized for handling large datasets and can stream data for real-time updates, making it suitable for big data visualization and live data applications.
- Customization and Styling: Bokeh offers a wide range of customization options for the appearance of plots, including colors, fonts, labels, and layouts, providing full control over the final look of visualizations.
55.Tidyverse Tool Overview
Tidyverse is a collection of R packages that are designed for data manipulation, exploration, and visualization. It provides a cohesive and consistent set of tools to make data analysis easier and more efficient. Key packages in the Tidyverse include ggplot2 (visualization), dplyr (data manipulation), tidyr (data tidying), and readr (data import).
Key Features of Tidyverse:
- Consistent Syntax: Tidyverse packages follow a consistent syntax, which makes it easier to learn and use the tools together seamlessly, improving productivity in data analysis tasks.
- Data Manipulation with dplyr: dplyr provides a set of intuitive functions for data manipulation tasks like filtering, grouping, summarizing, and arranging data, making it easy to work with structured data.
- Data Tidying with tidyr: tidyr allows users to clean and reshape their data with functions like gather() and spread(), helping to organize data in a tidy format that’s easy to analyze.
- Visualization with ggplot2: ggplot2 is the go-to tool in Tidyverse for creating static, publication-quality visualizations using a layered grammar of graphics approach, making it ideal for statistical plots.
- Efficient Data Import: The Tidyverse also includes readr, which simplifies reading and writing data files (e.g., CSV, Excel), and ensures fast and efficient data import, especially for large datasets.
56.Scrapy Tool Overview
Scrapy is a powerful, open-source web crawling and web scraping framework written in Python. It is used to extract data from websites and process it as per requirements. Scrapy is designed for both simple and complex web scraping tasks and is capable of handling large-scale web scraping projects efficiently. It offers tools for extracting data, handling requests, and even processing the scraped data in various formats like JSON, CSV, or XML.
Key Features of Scrapy
- Efficient Web Crawling: Scrapy is built for efficient web crawling, allowing you to collect large volumes of data quickly and easily across multiple pages and sites.
- Asynchronous Architecture: Scrapy uses an asynchronous mechanism that allows it to handle many requests concurrently, improving performance and reducing scraping time.
- Built-in Support for Data Export: Scrapy can export scraped data directly into various formats like JSON, CSV, and XML, simplifying the data collection process.
- Advanced Request Handling: Scrapy has built-in features for handling requests, such as following links, handling cookies, and managing user-agent strings, allowing for better control of scraping.
- Powerful Middleware: Scrapy offers a robust middleware system that helps with tasks like handling redirects, custom user agents, and setting up proxy servers for anonymous scraping.
59.BeautifulSoup Tool Overview
BeautifulSoup is a Python library for parsing HTML and XML documents, enabling easy extraction of data from web pages. It provides Pythonic ways to navigate and manipulate parsed data, making it an essential tool for web scraping and data extraction tasks. While it is not as feature-rich as Scrapy for large-scale crawling, BeautifulSoup is more lightweight and is often used for smaller, simpler scraping tasks.
Key Features of BeautifulSoup
- Simple and Intuitive Syntax: BeautifulSoup provides a simple API that makes it easy to navigate and search HTML/XML documents, ideal for beginners in web scraping.
- Parsing Support: It supports parsing HTML, XML, and other markup languages, and can handle poorly-formed or broken HTML gracefully, ensuring better accuracy during scraping.
- Flexible Searching: BeautifulSoup allows you to search for elements by tag name, attributes, CSS selectors, and more, making it highly flexible in locating the desired data.
- Tree Navigation: BeautifulSoup represents the document as a tree structure, making it easy to traverse, extract, and manipulate elements using methods like .find(), .find_all(), and .select().
- Lightweight and Easy to Use: BeautifulSoup is lightweight and does not require a complex setup, making it perfect for simple scraping tasks without the overhead of a full-fledged scraping framework
60.NLTK (Natural Language Toolkit) Tool Overview:
NLTK (Natural Language Toolkit) is a popular Python library used for natural language processing (NLP). It offers a wide range of tools for processing human language data, including tokenization, part-of-speech tagging, named entity recognition, and parsing. NLTK is widely used for research, educational purposes, and basic NLP tasks.
Key Features of NLTK
- Comprehensive NLP Tools: NLTK provides a wide range of NLP features, including tokenization, stemming, lemmatization, part-of-speech tagging, parsing, and text classification.
- Corpora and Lexical Resources: It offers access to several linguistic corpora and word lists, such as WordNet, making it easy to work with a variety of linguistic data.
- Text Classification: NLTK provides tools for text classification, allowing you to build machine learning models for classifying and analyzing text data.
- Educational Focus: NLTK is often used in academic settings due to its extensive documentation, tutorials, and resources that help users learn the fundamentals of NLP.
- Simple and Easy to Learn: NLTK’s API is beginner-friendly, making it a good starting point for anyone learning NLP or working on small-scale NLP projects.
61.SpaCy Tool Overview
SpaCy is an open-source library for advanced natural language processing in Python. It is designed for performance, efficiency, and ease of use, with an emphasis on real-world NLP applications. SpaCy provides state-of-the-art tools for tasks like tokenization, named entity recognition (NER), part-of-speech tagging, dependency parsing, and more.
Key Features of SpaCy
- Fast and Efficient: SpaCy is optimized for performance, processing large volumes of text quickly. It is designed to be used in production environments with real-time data.
- Pre-trained Models: SpaCy provides pre-trained models for various languages, including English, Spanish, and German, which can be used directly for NLP tasks like NER and syntactic parsing.
- Named Entity Recognition (NER): SpaCy is highly accurate in identifying named entities such as dates, locations, and organizations within text, making it suitable for extracting structured data from unstructured text.
- Dependency Parsing: SpaCy includes a powerful dependency parser that analyzes the grammatical structure of sentences, identifying relationships between words.
- Machine Learning Integration: SpaCy can easily be integrated with machine learning libraries like TensorFlow and PyTorch, allowing for custom model training and advanced NLP tasks.
62.Vowpal Wabbit Tool Overview
Vowpal Wabbit (VW) is an open-source machine learning library developed by Microsoft. It is designed for fast and efficient training of large-scale machine learning models, particularly suited for large datasets and real-time applications. VW is known for its speed and scalability and is used for tasks such as classification, regression, and reinforcement learning.
Key Features of Vowpal Wabbit
- Fast and Scalable: VW is highly optimized for speed and can handle large-scale datasets efficiently, making it suitable for big data applications.
- Support for Online Learning: Vowpal Wabbit supports online learning, allowing it to update models with new data without needing to retrain from scratch.
- Wide Range of Machine Learning Algorithms: VW supports various machine learning algorithms, including linear models, logistic regression, classification, regression, and reinforcement learning.
- Efficient Memory Usage: VW is designed to minimize memory usage, allowing it to work with large datasets that do not fit entirely into memory.
- Extensible and Flexible: It offers support for a variety of advanced features, such as feature hashing, multi-class classification, and custom loss functions, making it versatile for different use cases.
63.OpenCV Tool Overview
OpenCV (Open Source Computer Vision Library) is a popular open-source library used for computer vision and image processing tasks. It provides a comprehensive set of tools for real-time computer vision applications such as object detection, facial recognition, and image manipulation. OpenCV supports a wide range of image and video processing tasks and works well with both traditional image processing techniques and modern deep learning models.
Key Features of OpenCV
- Image and Video Processing: OpenCV provides extensive tools for manipulating and processing images and videos, such as filtering, edge detection, and image enhancement.
- Real-time Computer Vision: It is optimized for real-time applications, making it suitable for tasks like object tracking, face recognition, and live video processing.
- Deep Learning Integration: OpenCV can integrate with deep learning frameworks like TensorFlow and PyTorch, allowing for the use of pre-trained models for advanced computer vision tasks like object detection and segmentation.
- Cross-Platform: OpenCV is cross-platform and works on various operating systems, including Windows, Linux, macOS, and mobile platforms like Android and iOS.
- Extensive Documentation and Community: OpenCV has a large community and extensive documentation, including tutorials and examples, making it accessible for both beginners and experts in computer vision.
64.Gephi Tool Overview
Key Features of Gephi
- Graph Visualization: Gephi offers powerful visualization tools to display networks and graphs, with various layouts (e.g., ForceAtlas, Yifan Hu) to help users explore data structures visually.
- Real-time Exploration: Gephi supports real-time graph manipulation and exploration, allowing users to filter, zoom, and interact with the network to reveal important insights.
- Network Analysis Tools: Gephi includes a variety of analysis algorithms, such as centrality measures, community detection, clustering, and more, to help analyze the properties and dynamics of networks.
- Extensive File Format Support: It supports a wide range of data formats for importing and exporting network data, including CSV, GML, GraphML, and Pajek.
- Dynamic Graphs: Gephi allows for the visualization of dynamic networks, where nodes and edges can change over time, making it suitable for time-based network analysis.
65.Airflow Tool Overview:
Key Features of Airflow
- Workflow Orchestration: Airflow enables the scheduling, execution, and monitoring of workflows, ensuring that each task in a pipeline is executed in the correct order.
- Dynamic Pipeline Creation: Pipelines are defined using Python scripts, allowing users to programmatically build, schedule, and manage their workflows with ease.
- Scalable: Airflow is designed to scale horizontally, allowing it to handle complex and large data workflows across many machines.
- Extensive Integrations: It integrates with a variety of data sources, cloud platforms, and technologies like AWS, Google Cloud, and Hadoop, making it versatile for modern data engineering needs.
- Rich UI and Monitoring: Airflow comes with an intuitive web-based user interface for monitoring, debugging, and managing workflows, including task retries, status tracking, and logs.
66.Luigi Tool Overview
Key Features of Luigi
- Task Dependency Management: Luigi enables easy definition of tasks and their dependencies, ensuring tasks are executed in the correct order and tracking task statuses.
- Pipeline Management: It is specifically designed for managing long-running and complex data workflows, making it suitable for tasks like ETL processes or machine learning pipelines.
- Extensible: Luigi is highly extensible and allows users to integrate with other systems, databases, cloud services, and more, making it versatile for various use cases.
- Built-in Scheduler: Luigi comes with a built-in scheduler to handle task execution and ensures that the tasks run according to the defined schedule.
- Visualization and Monitoring: It provides a web interface for monitoring and visualizing workflows, showing task statuses, dependencies, and logs.
67.Docker Tool Overview
Key Features of Docker
- Containerization: Docker packages applications and their dependencies into lightweight, portable containers, ensuring consistent execution across different environments (local, development, staging, production).
- Isolation: Docker provides process isolation, which ensures that applications and services run in separate environments, preventing conflicts between different applications or versions.
- Scalability and Flexibility: Docker allows for easy scaling of applications, enabling quick deployment of new instances or containers. It can be integrated with orchestration tools like Kubernetes for managing containerized applications at scale.
- Version Control for Containers: Docker supports versioning of container images, making it easy to manage different versions of applications and roll back to previous versions if necessary.
- Integration with CI/CD Pipelines: Docker integrates seamlessly with continuous integration and continuous deployment (CI/CD) pipelines, automating the testing, building, and deployment of containerized applications.
Data Science Tool List
Frequently Asked Questions
1. What is a data science tool?
A data science tool is a software application or framework used by data scientists to analyze, visualize, and interpret data. These tools help in data cleaning, modelling, and deployment of machine learning algorithms, among other tasks.
2. Why is it important to have a list of data science tools?
Having a list of data science tools helps practitioners choose the right tools for their specific tasks and projects. It also provides insights into the most effective tools available in the industry, facilitating better decision-making.
3. What are some popular programming languages used in data science?
The most popular programming languages in data science include Python, R, and SQL. Python is widely used for its versatility and extensive libraries, while R is favoured for statistical analysis and data visualization.
4. What are some commonly used libraries in Python for data science?
Key Python libraries include:
Pandas for data manipulation and analysis
NumPy for numerical computations
Matplotlib and Seaborn for data visualization
Scikit-learn for machine learning
TensorFlow and Keras for deep learning
5. What role does R play in data science?
R is a coding language created for statistical analysis and displaying data. It offers a vast ecosystem of packages that facilitate advanced analytics and data manipulation.
6. What are some common data visualization tools?
Popular data visualization tools include:
- Tableau for interactive visual analytics
- Power BI for business intelligence
- Matplotlib and Seaborn in Python
- ggplot2 in R
7. What is the significance of SQL in data science?
Relational database management and querying rely heavily on the use of SQL (Structured Query Language). It allows data scientists to extract, manipulate, and analyze data stored in databases effectively.
8. What are cloud-based data science tools?
Cloud-based data science tools, such as Google Cloud AI, Microsoft Azure Machine Learning, and Amazon SageMaker, offer scalable resources and collaborative features for data analysis and machine learning without the need for local infrastructure.
9. How do I choose the right tool for my data science project?
Choosing the right tool depends on several factors, including the type of data you are working with, the specific tasks you need to perform, your team’s expertise, and the project requirements. It’s essential to evaluate tools based on functionality, ease of use, and community support.
10. Are there any open-source data science tools available?
Yes, many open-source data science tools are available, including:
- Jupyter Notebook for interactive computing
- Apache Spark for big data processing
- RStudio for R programming
- KNIME for data analytics and reporting
11. What is the role of machine learning frameworks in data science?
Machine learning frameworks, such as TensorFlow, PyTorch, and Scikit-learn, provide pre-built algorithms and tools for building, training, and deploying machine learning models efficiently, enabling data scientists to focus on solving complex problems.
12. Can I learn data science tools without prior programming experience?
While prior programming experience can be beneficial, many data science tools have user-friendly interfaces and extensive documentation that allow beginners to learn and use them effectively. Online courses and tutorials can also help build foundational skills.
13. What are some tools for data cleaning and preprocessing?
Common tools for data cleaning and preprocessing include:
- Pandas in Python
- OpenRefine for data transformation
- Trifacta for data wrangling
- Dask for parallel computing with larger datasets
14. How do data science tools facilitate collaboration among teams?
Many data science tools offer features that enhance collaboration, such as version control (e.g., Git), cloud-based platforms for sharing work (e.g., Google Colab), and integrated development environments (IDEs) that support teamwork and sharing of code and results.
15. Where can I find resources to learn more about data science tools?
You can find numerous resources online, including:
- MOOCs (Massive Open Online Courses) on platforms like Coursera and edX
- Data science blogs and forums
- YouTube tutorials
- Official documentation for specific tools and libraries