
Data Science Course Syllabus

Data science course syllabus key components
1. Introduction to Data Science
- Overview of Data Science
- Data Science Lifecycle
- Applications of Data Science
- Key Skills Required
2. Data Acquisition and Cleaning
- Data Collection from Multiple Sources (APIs, Databases, Web Scraping)
- Introduction to Data Cleaning
- Handling Missing Data
- Data Transformation and Normalization
- Data Wrangling using Python Libraries (Pandas, NumPy)
3. Exploratory Data Analysis (EDA)
- Data Visualization Techniques
- Univariate and Bivariate Analysis
- Graphical Representations (Matplotlib, Seaborn, Plotly)
- Identifying Trends, Patterns, and Outliers
4. Statistics for Data Science
- Descriptive Statistics (Mean, Median, Mode, Standard Deviation)
- Probability Distributions
- Hypothesis Testing
- Confidence Intervals
- Regression Analysis
5. Machine Learning Basics
- Introduction to Machine Learning Algorithms
- Supervised vs. Unsupervised Learning
- Training and Testing Models
- Evaluation Metrics (Accuracy, Precision, Recall, F1-Score)
- Cross-validation
6. Supervised Learning
- Linear and Logistic Regression
- Decision Trees and Random Forests
- Support Vector Machines (SVM)
- K-Nearest Neighbors (KNN)
- Model Selection and Tuning (Grid Search, Hyperparameter Tuning)
7. Unsupervised Learning
- Clustering (K-Means, Hierarchical Clustering)
- Dimensionality Reduction (PCA, t-SNE)
- Anomaly Detection
8. Deep Learning
- Introduction to Neural Networks
- Feedforward Neural Networks (FNN)
- Convolutional Neural Networks (CNN)
- Recurrent Neural Networks (RNN)
- Deep Learning Libraries (TensorFlow, Keras, PyTorch)
9. Natural Language Processing (NLP)
- Text Preprocessing (Tokenization, Lemmatization)
- Text Vectorization (TF-IDF, Word2Vec)
- Sentiment Analysis
- Named Entity Recognition (NER)
- NLP with Python (NLTK, SpaCy)
10. Time Series Analysis
- Time Series Decomposition
- ARIMA Models
- Forecasting Techniques
- Applications in Business and Finance
11. Big Data Technologies
- Introduction to Big Data
- Hadoop and Spark Basics
- Data Processing with PySpark
- Handling Large Datasets in Data Science
12. Data Science Project
- End-to-End Data Science Project
- Problem Definition and Data Collection
- Data Cleaning and Exploration
- Model Building and Evaluation
- Presentation of Results
13. Ethical Considerations in Data Science
- Bias and Fairness in Models
- Data Privacy and Security
- Responsible AI
14. Tools and Libraries
- Python for Data Science
- Jupyter Notebooks
- SQL for Data Science
- Git and Version Control
15. Capstone Project
- Choosing a Real-World Problem
- Implementing Data Science Models
- Presenting and Documenting Findings
16. Conclusion
- Future Scope of Data Science
- Career Opportunities
- Final Thoughts

1. Introduction to what is Data Science
Overview of Data Science
- Data Science is an interdisciplinary field that applies statistical methods, machine learning, and data processing to extract insights from structured and unstructured data.
- It plays a vital role in decision-making, predictive modeling, and automation across various industries.
Data Science Lifecycle
- The lifecycle begins with problem identification, followed by data collection from sources like databases and APIs. The next step, data cleaning, ensures accuracy by handling missing values and outliers.
- Exploratory Data Analysis (EDA) identifies trends, while feature engineering prepares data for models.
- Model building and evaluation involve selecting algorithms and assessing performance using metrics.
- Finally, deployment and monitoring ensure real-world application and continuous improvement.
Applications of Data Science
- Data Science is used in healthcare for disease prediction, finance for fraud detection, e-commerce for recommendations, and marketing for customer segmentation.
- Social media platforms use it for sentiment analysis, while manufacturing benefits from predictive maintenance. In cybersecurity, it helps detect threats and anomalies.
Key Skills Required
- Essential skills include programming (Python, R, SQL), mathematics and statistics (probability, calculus), and machine learning techniques.
- Data wrangling and visualization (Matplotlib, Seaborn, Tableau) aid analysis. Knowledge of big data tools (Hadoop, Spark) and cloud platforms (AWS, GCP, Azure) is valuable. Strong communication skills help present insights effectively.
2. Data Acquisition and Cleaning
Data Collection from Multiple Sources
- Data collection is the first step in any data-driven process, involving the extraction of information from various sources.
- These sources include APIs (used to fetch real-time data from web services), databases (structured storage like MySQL, and PostgreSQL), and web scraping (extracting data from websites using tools like BeautifulSoup and Scrapy).
- Effective data collection ensures quality and completeness for analysis.
Introduction to Data Cleaning
- Raw data is often noisy, inconsistent, or incomplete, making data cleaning a crucial step. This process involves identifying and fixing errors, removing duplicates, standardizing formats, and ensuring data accuracy.
- Clean data improves model performance and decision-making.
Handling Missing Data
- Missing data can impact analysis and predictions. It can be handled using techniques such as deletion (removing rows or columns with too many missing values), imputation (filling missing values with mean, median, or mode), or advanced methods like machine learning-based predictions to estimate missing values.
Data Transformation and Normalization
- Data transformation prepares data for analysis by converting it into a suitable format. This includes scaling (Min-Max, Standardization), encoding categorical variables, and log transformations to handle skewed distributions. Normalization ensures consistency, making comparisons and modelling more effective.
Data Wrangling using Python Libraries
- Data wrangling involves reshaping, merging, and cleaning data using Python libraries. Pandas is widely used for handling structured data with DataFrames, while NumPy provides efficient numerical operations.
- These libraries help in data manipulation, making it easier to analyze and preprocess data for machine learning models.
3. Exploratory Data Analysis (EDA)
Data Visualization Techniques
- Data visualization is essential in EDA to help understand the structure, patterns, and insights within the data.
- Common techniques include histograms, bar charts, scatter plots, and heat maps.
- These visual tools make it easier to identify relationships between variables and spot anomalies or trends.
- Effective visualizations help in communicating findings to stakeholders and guiding further analysis.
Univariate and Bivariate Analysis
- Univariate analysis examines one variable at a time. This involves understanding its distribution and central tendency using visualizations like histograms, box plots, and pie charts.
- Bivariate analysis explores relationships between two variables, often using scatter plots, correlation matrices, and line graphs. It helps to determine if and how two variables are related, such as detecting linear or non-linear relationships.
Graphical Representations (Matplotlib, Seaborn, Plotly)
- Matplotlib is a fundamental library for creating static, animated, and interactive plots in Python. It is highly customizable and widely used for basic visualizations.
- Seaborn is built on top of Matplotlib and offers a higher-level interface for creating attractive, informative statistical graphics like heatmaps, pair plots, and violin plots.
- Plotly is used for creating interactive visualizations, often used in dashboards and web applications, allowing users to hover over or zoom into specific areas for more details.
Identifying Trends, Patterns, and Outliers
- EDA helps spot important trends and patterns in the data, which are crucial for predictive modeling.
- Trends may indicate consistent changes over time, while patterns might reflect correlations between variables.
- Outliers, or data points that deviate significantly from the rest, can skew analysis and should be identified and either removed or adjusted.
- Techniques like box plots, scatter plots, and z-scores are commonly used to detect and analyze outliers.
4. Statistics for Data Science
Descriptive Statistics (Mean, Median, Mode, Standard Deviation)
Descriptive statistics summarize the main features of a dataset, providing a simple overview.
- Mean is the average value of a dataset and is used to represent the central tendency.
- The median is the middle value when the data is sorted, providing a better measure of central tendency when the data is skewed.
- Mode is the most frequently occurring value in the dataset, useful for categorical data.
- Standard Deviation measures the spread or dispersion of data around the mean, helping to understand the variability or consistency in the dataset.
Probability Distributions
Probability distributions describe how the values of a random variable are distributed.
- Normal distribution (bell curve) is the most common and is characterized by a mean of 0 and a standard deviation of 1.
- The binomial distribution is used for discrete data, such as success/failure outcomes.
Poisson distribution models the number of occurrences of an event in a fixed interval.
These distributions are essential for modeling data, understanding uncertainties, and making predictions.
Hypothesis Testing
Hypothesis testing is used to make inferences or draw conclusions about a population based on sample data.
- It involves setting up a null hypothesis (H₀) and an alternative hypothesis (H₁).
- A test statistic is calculated, and the p-value is compared to a significance level (usually 0.05) to determine whether to accept or reject the null hypothesis.
Common tests include t-tests, chi-square tests, and ANOVA.
Confidence Intervals
A confidence interval provides a range of values within which a population parameter is likely to lie, with a certain level of confidence (usually 95% or 99%).
- It is often used to estimate the true population mean based on sample data.
- A wider interval indicates more uncertainty, while a narrower interval suggests higher precision.
Regression Analysis
Regression analysis models the relationship between a dependent variable and one or more independent variables.
- Linear regression is used for modeling the relationship between two continuous variables (one dependent and one independent).
- Multiple regression involves more than one independent variable.
- Regression helps predict outcomes, understand relationships, and analyze trends. It is widely used in forecasting and risk assessment.
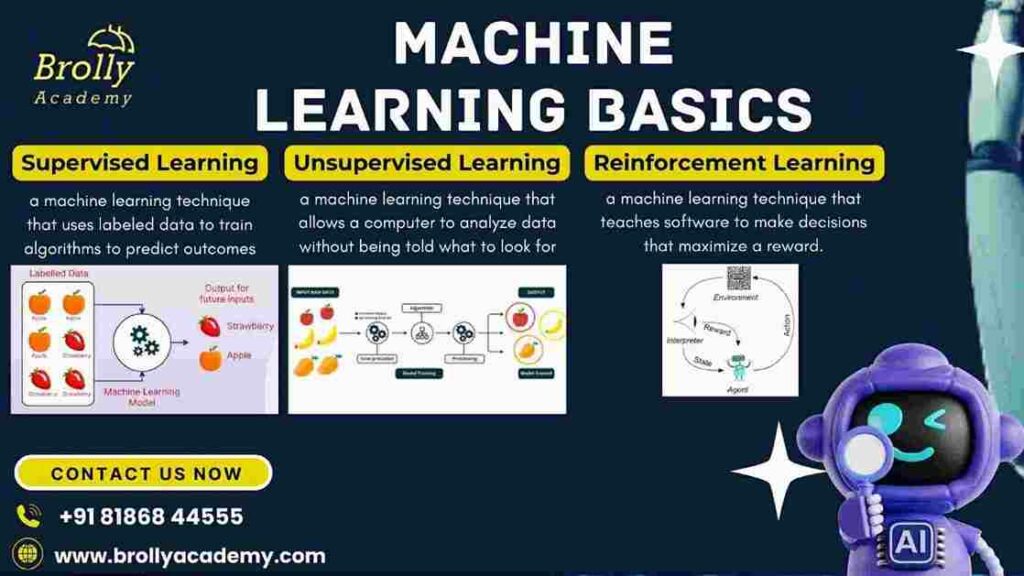
5. Machine Learning Basics
Introduction to Machine Learning Algorithms
- Machine Learning (ML) is a subset of artificial intelligence that allows computers to learn from data and make predictions or decisions without being explicitly programmed.
- ML algorithms are designed to identify patterns in data and use them to make predictions or automate tasks. Common types of ML algorithms include linear regression, decision trees, support vector machines (SVM), and neural networks.
- The choice of algorithm depends on the problem being solved, the type of data available, and the desired outcome.
Supervised vs. Unsupervised Learning
- Supervised Learning involves training a model on labeled data, meaning the input data includes both the features and corresponding target labels (outputs).
- The goal is to learn a mapping from input to output. Common algorithms include linear regression, logistic regression, decision trees, and random forests.
- Unsupervised Learning deals with data that has no labelled outcomes.
- The goal is to find hidden patterns or intrinsic structures in the data. Common techniques include clustering (e.g., K-means) and dimensionality reduction (e.g., PCA).
- This type of learning is often used for market segmentation, anomaly detection, and feature extraction.
Training and Testing Models
- In machine learning, models are trained using a subset of the data (training set) and tested on a separate subset (testing set) to evaluate their performance.
- The model learns the underlying patterns during training and is then tested to determine how well it generalizes to new, unseen data.
- This process helps prevent overfitting, where a model is too closely tailored to the training data and performs poorly on new data.
Evaluation Metrics (Accuracy, Precision, Recall, F1-Score)
After training and testing a model, evaluation metrics help determine how well it performs:
- Accuracy is the percentage of correct predictions out of all predictions. It is useful when classes are balanced but may be misleading with imbalanced datasets.
- Precision measures the proportion of true positives among all positive predictions. It’s important when false positives are costly, such as in medical diagnostics.
- Recall (or Sensitivity) measures the proportion of true positives among all actual positives. It’s crucial when missing positive instances is costly.
- F1-Score is the harmonic mean of precision and recall, offering a balance between the two metrics. It is useful when both false positives and false negatives are important.
Cross-validation
- Cross-validation is a technique used to evaluate the model’s performance and improve its robustness by splitting the dataset into multiple subsets (folds).
- The model is trained on a subset and tested on the remaining data, repeating the process for all subsets.
- This technique provides a more reliable estimate of model performance and helps to mitigate overfitting.
- A common approach is k-fold cross-validation, where the data is split into k folds, and the model is trained and tested k times, each time using a different fold for testing and the rest for training.
6. Supervised Learning
Linear and Logistic Regression
- Linear Regression is a simple algorithm used to model the relationship between a continuous dependent variable and one or more independent variables. It predicts values based on a linear equation of the form y=mx+by = mx + b. It’s widely used for predicting numerical outcomes like house prices or sales revenue.
- Logistic Regression is used for binary classification problems, where the goal is to predict a binary outcome (e.g., yes/no, 0/1). It applies a logistic function (sigmoid) to the linear output to restrict the predictions to a probability between 0 and 1, making it ideal for classification tasks.
Decision Trees and Random Forests
- Decision Trees are tree-like structures where each node represents a decision based on a feature, and branches represent the outcomes.
- It’s a popular algorithm for both classification and regression tasks.
- The tree is built by splitting the data at each node based on a feature that results in the best possible separation (using criteria like Gini impurity or information gain).
- Random Forests are ensembles of decision trees. By combining multiple decision trees, each trained on a random subset of the data, random forests improve predictive accuracy and reduce overfitting compared to a single decision tree.
- Random Forests work well for complex datasets and can be used for both classification and regression tasks.
Support Vector Machines (SVM)
- Support Vector Machines (SVM) are powerful classifiers used for both linear and non-linear classification tasks.
- SVM aims to find a hyperplane that best separates data into different classes by maximizing the margin (distance between the hyperplane and the nearest data points from each class).
- It can be used for both binary and multiclass classification.
- In cases where data is not linearly separable, SVM uses kernel functions (like polynomial or radial basis functions) to map data into higher dimensions, making it linearly separable in that space.
K-Nearest Neighbors (KNN)
- K-Nearest Neighbors (KNN) is a non-parametric, instance-based learning algorithm used for classification and regression tasks.
- The algorithm works by finding the k nearest data points (neighbours) to a given point and assigning the most frequent class (in classification) or the average value (in regression).
- KNN does not require training, as it stores the entire dataset and makes predictions based on proximity to other data points.
- It’s computationally expensive but simple and effective, especially for small datasets.
Model Selection and Tuning (Grid Search, Hyperparameter Tuning)
- Model Selection involves choosing the best algorithm for a given problem. Different algorithms have strengths and weaknesses, so selecting the right one is crucial for achieving the best performance.
- Hyperparameter Tuning is the process of optimizing the hyperparameters (parameters set before training) of a machine learning model to improve its performance. Common techniques include:
- Grid Search: Exhaustively searches through a predefined set of hyperparameters (like learning rate, depth of a tree, or a number of neighbours in KNN) to find the optimal combination.
- Random Search: Randomly selects hyperparameters within a given range and tests them, which can be faster than grid search in high-dimensional spaces.
- Bayesian Optimization: A more advanced method for hyperparameter tuning that uses probabilistic models to select the most promising hyperparameters.
7. Unsupervised Learning
Clustering (K-Means, Hierarchical Clustering)
- K-means clustering is a popular algorithm used to partition data into a specified number of clusters (K). The algorithm assigns data points to the nearest cluster centre (centroid) and iteratively refines the centroids until convergence.
- It works well for datasets where the number of clusters is known in advance and the data has well-separated, spherical clusters.
- Hierarchical Clustering creates a tree-like structure (dendrogram) that shows the hierarchical relationships between data points. It does not require specifying the number of clusters upfront.
- It can be agglomerative (merging small clusters into larger ones) or divisive (splitting large clusters into smaller ones).
- This method is useful when the number of clusters is unknown or when understanding the hierarchy of clusters is important.
Dimensionality Reduction (PCA, t-SNE)
- Principal Component Analysis (PCA) is a linear technique used to reduce the dimensionality of large datasets while retaining as much variability as possible.
- It identifies the principal components (directions of maximum variance) and projects the data onto these components, reducing the number of features.
- PCA is often used for preprocessing in machine learning and visualizing high-dimensional data in lower dimensions.
- t-Distributed Stochastic Neighbor Embedding (t-SNE) is a non-linear dimensionality reduction technique primarily used for visualizing high-dimensional data in 2D or 3D.
- It works by minimizing the divergence between probability distributions that represent pairwise similarities of data points in high-dimensional space and low-dimensional space.
- t-SNE is particularly effective for clustering and visualizing complex, non-linear data patterns.
Anomaly Detection
Anomaly detection identifies rare or unusual data points that do not conform to expected patterns. It’s essential in fraud detection, network security, and fault detection. There are different approaches for anomaly detection, including:
- Statistical methods, assume that the majority of data follows a known distribution and identify outliers based on statistical significance.
- Distance-based methods (e.g., K-Nearest Neighbors), where anomalies are detected based on how far a point is from its neighbours.
- Density-based methods (e.g., DBSCAN), which detect anomalies by identifying areas of lower data density.
Anomaly detection helps in identifying novel or rare events that are worth further investigation.
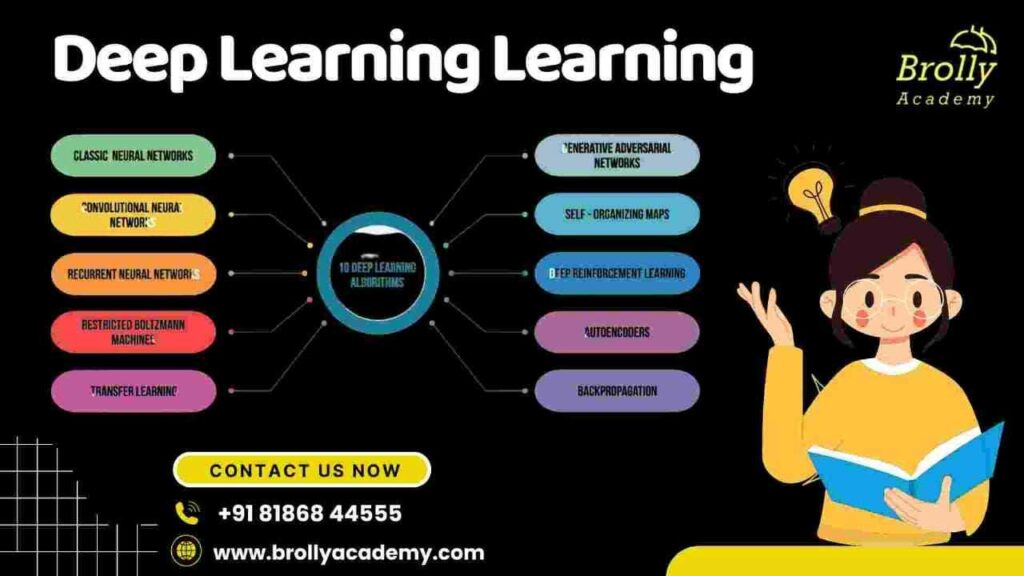
8. Deep Learning
Introduction to Neural Networks
- Neural networks are a core component of deep learning, which is a subset of machine learning.
- A neural network consists of layers of interconnected nodes (neurons) that mimic the way the human brain processes information.
- These networks are capable of learning from large datasets and making complex predictions or classifications.
- Deep learning models use multiple layers of neurons, enabling them to automatically learn hierarchical features from raw data, such as images, text, and audio.
Feedforward Neural Networks (FNN)
- Feedforward Neural Networks (FNN) are the simplest type of artificial neural network where the data moves in one direction—forward—through the layers.
- These networks consist of an input layer, one or more hidden layers, and an output layer.
- Each neuron in one layer connects to every neuron in the next layer. FNNs are commonly used for classification and regression tasks.
- The training process involves adjusting the weights of the connections between neurons using backpropagation to minimize the error in predictions.
Convolutional Neural Networks (CNN)
- Convolutional Neural Networks (CNN) are designed to process grid-like data, such as images, by using convolutional layers that apply filters (kernels) to input data.
- These layers extract important features such as edges, textures, and shapes, which are then used for tasks like image classification, object detection, and segmentation.
- CNNs are particularly effective for computer vision tasks due to their ability to learn spatial hierarchies of features.
- They also incorporate pooling layers to reduce dimensionality and increase computational efficiency.
Recurrent Neural Networks (RNN)
- Recurrent Neural Networks (RNN) are specialized for sequential data, such as time series, speech, or text.
- Unlike feedforward networks, RNNs have connections that loop back on themselves, allowing information to persist and be used in subsequent steps.
- This makes RNNs effective for tasks like language modelling, speech recognition, and sentiment analysis.
- Long Short-Term Memory (LSTM) and Gated Recurrent Unit (GRU) networks are specialized types of RNNs designed to address the problem of vanishing gradients and improve performance on long-term dependencies in data.
Deep Learning Libraries (TensorFlow, Keras, PyTorch)
- TensorFlow is an open-source deep-learning library developed by Google. It provides tools to design, train, and deploy machine learning models, including neural networks.
- TensorFlow is highly scalable and suitable for both research and production environments.
- Keras is an open-source high-level API for building neural networks, designed to work with TensorFlow (and other backends).
- It provides a simple interface for designing deep learning models quickly and with minimal code. Keras is particularly popular for rapid prototyping.
- PyTorch is another open-source deep-learning library, developed by Facebook. PyTorch provides dynamic computation graphs, which are more flexible for research and development.
- It is widely used in academic research and is known for its ease of use and integration with Python. PyTorch also has robust support for GPUs, which accelerates model training.
9. Natural Language Processing (NLP)
Text Preprocessing (Tokenization, Lemmatization)
Text preprocessing is an essential step in NLP to clean and prepare the data for analysis.
- Tokenization is the process of splitting text into smaller units, typically words or sentences, called tokens.
- Tokenization allows the model to handle text as discrete units, facilitating analysis and model training.
- Lemmatization is the process of reducing words to their base or root form. Unlike stemming, which simply removes suffixes, lemmatization ensures the resulting words are valid (e.g., “running” becomes “run”, “better” becomes “good”).
- This helps in standardizing the text and improving the accuracy of NLP models.
Text Vectorization (TF-IDF, Word2Vec)
Text vectorization is the process of converting text into numerical representations that machine learning models can understand.
- TF-IDF (Term Frequency-Inverse Document Frequency) is a statistical measure used to evaluate the importance of a word in a document relative to the entire corpus. It helps identify words that are significant to a document while reducing the weight of common words that appear in many documents.
- Word2Vec is a technique that uses neural networks to learn dense vector representations of words based on their context in large corpora.
- It captures semantic relationships between words (e.g., “king” – “man” + “woman” = “queen”), making it useful for tasks like word similarity and analogy.
Sentiment Analysis
- Sentiment Analysis is the process of determining the emotional tone or sentiment behind a piece of text, typically classifying it as positive, negative, or neutral.
- It is widely used in applications like analyzing customer feedback, social media monitoring, and product reviews.
- Sentiment analysis models can be built using techniques like supervised learning, where a labelled dataset of text and sentiments is used to train the model.
Named Entity Recognition (NER)
- Named Entity Recognition (NER) is a task in NLP where entities such as names of people, locations, dates, organizations, and other specific items are identified and classified in text.
- For example, in the sentence “Apple Inc. was founded by Steve Jobs in Cupertino in 1976,” a NER model would extract “Apple Inc.” as an organization, “Steve Jobs” as a person, “Cupertino” as a location, and “1976” as a date. NER is widely used in information extraction and question-answering systems.
NLP with Python (NLTK, SpaCy)
- NLTK (Natural Language Toolkit) is one of the most widely used libraries for working with human language data in Python. It provides tools for text preprocessing, tokenization, part-of-speech tagging, NER, and many other NLP tasks. NLTK is highly flexible and is often used for educational purposes and research.
- SpaCy is a fast, efficient, and production-ready NLP library for Python. It is designed for large-scale applications and offers features like tokenization, part-of-speech tagging, dependency parsing, and named entity recognition. SpaCy is highly optimized for performance and is widely used in industrial applications.
10. Time Series Analysis
Time Series Decomposition
Time series decomposition is the process of breaking down a time series into its constituent components:
- Trend: The long-term movement or direction in the data, which can either be increasing, decreasing, or flat.
- Seasonality: Regular, repeating patterns or cycles in the data, often related to time (e.g., sales increasing every holiday season).
- Noise: Random variations or irregular fluctuations that do not follow any predictable pattern.
Decomposition helps analysts understand underlying patterns and is an essential step before forecasting.
ARIMA Models
ARIMA (AutoRegressive Integrated Moving Average) is a powerful statistical model used for forecasting time series data. It combines three key components:
- AR (AutoRegressive): A model where the current value depends on its previous values.
- I (Integrated): Differencing the series to make it stationary (i.e., constant mean and variance over time).
- MA (Moving Average): A model where the current value depends on past forecast errors.
ARIMA models are commonly used for non-seasonal time series forecasting, but variations like SARIMA (Seasonal ARIMA) handle seasonal components.
Forecasting Techniques
Several techniques are used for forecasting time series data:
- Exponential Smoothing: A simple forecasting method that applies weights to past observations, with more recent data receiving higher weights.
- Popular methods include Simple Exponential Smoothing, Holt’s Linear Trend Model, and the Holt-Winters Seasonal Model.
- Machine Learning Methods: For more complex time series, machine learning techniques such as random forests, support vector machines (SVM), and LSTM (Long Short-Term Memory) networks can be used to capture non-linear relationships and long-term dependencies.
- Prophet: Developed by Facebook, Prophet is an open-source forecasting tool that automatically handles trends, seasonality, and holidays, providing a user-friendly interface for time series forecasting.
Applications in Business and Finance
Time series analysis plays a vital role in various industries:
- Business: Companies use time series analysis for sales forecasting, inventory management, demand forecasting, and resource planning.
- For instance, predicting sales volumes helps businesses optimize supply chains and ensure products are available when needed.
- Finance: Time series is essential for predicting stock prices, assessing economic indicators, and modelling financial assets.
- Techniques like ARIMA and GARCH (Generalized Autoregressive Conditional Heteroskedasticity) are often used for volatility forecasting and risk management.
- Economics: Time series models are used for economic forecasting, analyzing GDP, inflation rates, and unemployment rates, and helping governments and organizations make informed policy decisions.
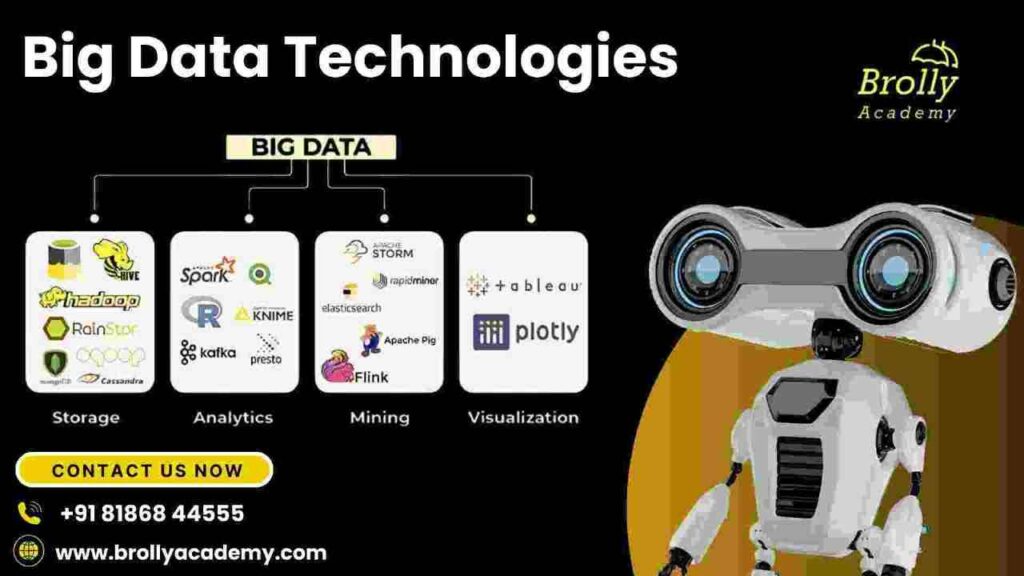
11. Big Data Technologies
Introduction to Big Data
Big Data refers to extremely large datasets that cannot be processed, stored, or analyzed using traditional data management tools. It involves three key characteristics known as the 3Vs:
- Volume: Refers to the vast amounts of data generated every day from various sources like social media, sensors, and transactions.
- Velocity: The speed at which data is generated and needs to be processed, often in real-time or near real-time.
- Variety: The different types of data, including structured, semi-structured, and unstructured data (e.g., text, images, and videos).
Big Data technologies enable organizations to process and analyze these massive datasets for insights, improving decision-making and innovation.
Hadoop and Spark Basics
- Hadoop is an open-source framework for storing and processing large datasets in a distributed computing environment.
- Its core components include the HDFS (Hadoop Distributed File System) for storing data across multiple nodes and MapReduce for processing the data in parallel. Hadoop enables scalable, fault-tolerant data processing for massive datasets.
- Apache Spark is another open-source distributed computing system that provides faster and more flexible data processing compared to Hadoop’s MapReduce.
- It supports in-memory processing, which significantly improves the speed of computations. Spark is widely used for both batch processing and real-time streaming data.
Data Processing with PySpark
PySpark is the Python API for Apache Spark, enabling Python developers to harness the power of Spark for big data processing. With PySpark, users can perform operations like:
- Data Loading and Transformation: Load large datasets from various sources (e.g., HDFS, CSV files, databases) and transform them using Spark DataFrame and RDD (Resilient Distributed Dataset) operations.
- Data Aggregation and Computation: Perform aggregations, groupings, and computations across large datasets in parallel. PySpark provides efficient operations like filtering, mapping, and reducing over large data.
- Machine Learning: PySpark integrates with MLlib for scalable machine learning, enabling algorithms like regression, classification, clustering, and recommendation on large datasets.
Handling Large Datasets in Data Science
Handling large datasets is a critical skill for data scientists working with Big Data. Some common techniques for managing big datasets include:
- Distributed Computing: Using clusters of machines to process data in parallel, which improves the scalability and performance of data processing tasks.
- Tools like Hadoop and Spark distribute data and tasks across multiple nodes in a cluster.
- Data Sampling: When working with very large datasets, it’s often useful to take a sample of the data to perform exploratory analysis or model development before scaling to the full dataset.
- Efficient Storage Formats: Storing data in efficient formats like Parquet or ORC, which are optimized for columnar storage and support high compression, reducing storage costs and improving read/write speeds.
- Cloud Platforms: Leveraging cloud platforms like AWS, Google Cloud, or Azure to store and process large datasets using their Big Data services like Amazon S3, Google BigQuery, or Azure Databricks, making it easier to scale resources as needed.
12. Data Science Project from Data Science Course Syllabus
End-to-End Data Science Project
An end-to-end data science project involves all stages of the data science workflow, from defining the problem to presenting the results. This process typically includes:
- Understanding the problem and identifying the goals of the analysis.
- Data collection from various sources.
- Data cleaning to handle missing values and remove outliers.
- Exploratory data analysis (EDA) to understand the data’s structure and relationships.
- Model selection and training to find the best algorithm.
- Evaluation and validation of the model.
- Result presentation to communicate findings effectively.
This process can be applied to real-world projects in various fields like healthcare, finance, marketing, and more.
Problem Definition and Data Collection
- The first step in any data science project is to clearly define the problem.
- This involves understanding the business or research objectives and translating them into data science terms.
- Once the problem is defined, the next step is data collection, where relevant data is gathered from multiple sources like APIs, databases, web scraping, or even public datasets.
- For instance, in a project to predict customer churn, data might be collected from customer databases, transaction histories, and demographic data.
Data Cleaning and Exploration
Once data is collected, the next step is data cleaning, which involves:
- Handling missing data (by imputation or removal).
- Removing or correcting any errors or inconsistencies in the data.
- Dealing with outliers that may distort analysis.
After cleaning, data exploration (or EDA) is performed to understand the structure and relationships in the data. - This involves visualizing the data with charts, computing summary statistics, and identifying patterns, correlations, and trends that can inform model building.
Model Building and Evaluation
- After understanding the data, the next step is to build models.
- This can involve selecting a suitable machine learning algorithm (e.g., regression, classification, clustering, etc.), training the model on the data, and tuning hyperparameters to improve performance.
- The model is then evaluated using metrics like accuracy, precision, recall, F1-score, or mean squared error, depending on the type of problem.
- In machine learning projects, cross-validation is used to validate the model on different subsets of the data, ensuring it generalizes well to unseen data.
Presentation of Results
- The final stage is presenting the results. Clear communication is key, especially when sharing findings with stakeholders or non-technical audiences.
- This involves creating visualizations (charts, graphs, dashboards) to illustrate insights, explaining the methods and findings, and providing actionable recommendations based on the data analysis.
- Effective presentations also summarize the model’s performance and any limitations or assumptions that were made during the project.
13. Ethical Considerations in Data Science
Bias and Fairness in Models
- Bias in models arises when training data reflects societal inequalities, leading to unfair outcomes.
- Ensuring fairness involves identifying and reducing biases like sampling bias or algorithmic bias.
- Techniques such as re-sampling or fairness constraints help ensure models treat all groups equitably.
Data Privacy and Security
- Data privacy involves protecting personal data from misuse.
- Privacy laws like GDPR and CCPA require responsible data handling.
- Data should be encrypted, and anonymization or pseudonymization techniques should be used to protect individuals’ identities.
- Secure data storage, access controls, and regular audits are essential for maintaining data security.
Responsible AI
- Responsible AI ensures AI systems are developed and used transparently and ethically.
- Key principles include transparency (understanding AI decision-making), accountability (holding developers responsible for outcomes), and continuous monitoring to ensure models remain fair and effective over time.
These ethical considerations help build trust and prevent harmful consequences in data science applications.
14. Tools and Libraries For Data Science Course Syllabus
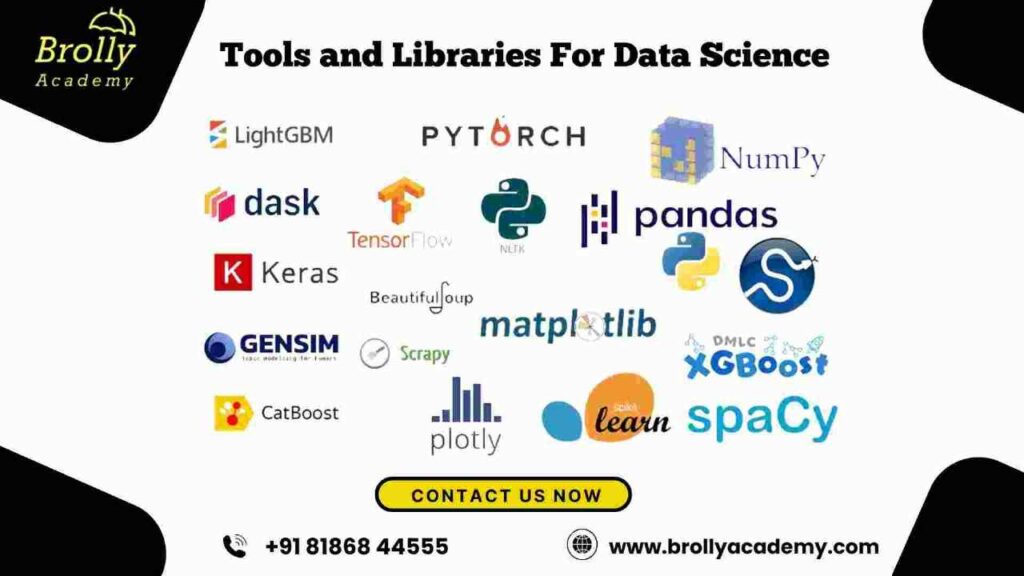
Python for Data Science
- Python is the most popular programming language for data science due to its simplicity and extensive library ecosystem.
- Libraries like Pandas, NumPy, Matplotlib, Seaborn, and Scikit-learn make data manipulation, analysis, and visualization easier.
- Python’s versatility in machine learning, statistical analysis, and deep learning (with libraries like TensorFlow and PyTorch) makes it the go-to tool for data science.
Jupyter Notebooks
- Jupyter Notebooks provide an interactive environment for writing and executing Python code, combining code, visualizations, and documentation in one place.
- They are ideal for data exploration, sharing findings, and creating reproducible reports.
- Notebooks allow for easy visualization of data insights with libraries like Matplotlib and Seaborn integrated seamlessly into the workflow.
SQL for Data Science
- SQL (Structured Query Language) is essential for working with relational databases.
- It allows data scientists to query large datasets efficiently, perform aggregations, and join multiple tables to extract meaningful insights.
- SQL skills are crucial for data extraction, manipulation, and transformation before applying advanced analytical techniques.
Git and Version Control
- Git is a version control system that tracks changes to code and data files, enabling collaboration and maintaining project history.
- GitHub or GitLab are platforms that facilitate team collaboration, allowing data scientists to work on projects together, manage code versions, and avoid conflicts.
- Version control is crucial for reproducibility and organizing data science workflows.
These tools and libraries are fundamental in building an effective and scalable data science workflow.
15. Capstone Project: Bringing It All Together
The capstone project is the most exciting part of a Data Science course syllabus because it allows students to put everything they’ve learned into practice. Instead of just learning theories and algorithms, students get hands-on experience solving real-world problems using Data Science techniques. The Data Science course is designed to ensure that students gain practical exposure along with theoretical knowledge. Think of it as your final exam, but instead of answering questions, you create a project showcasing your skills and applying everything you’ve learned throughout the course.
Choosing a Real-World Problem
The first step is selecting a problem that can be solved using data. This could be from any industry—healthcare, finance, retail, entertainment, or even social media. For example:
- Healthcare: Predicting diseases using patient data.
- Finance: Detecting fraudulent transactions in banking.
- Retail: Recommending products based on past purchases.
- Social Media: Analyzing sentiments in customer reviews.
By choosing a problem that is relevant and impactful, students learn how Data Science can be used to make decisions and improve businesses.
Implementing Data Science Models
Once a problem is selected, the next step is building a solution using Data Science techniques. This involves:
- Collecting and Cleaning Data: Finding relevant datasets and preparing them by handling missing values, duplicates, and inconsistencies.
- Exploring the Data: Using visualization tools to understand patterns, trends, and relationships.
- Applying Machine Learning or Deep Learning Models: Based on the problem, different algorithms are used. For example:
- A classification model to detect fraud.
- A regression model to predict sales.
- A deep learning model to analyze images or text.
- Testing and Improving the Model: Evaluating accuracy and making adjustments to improve performance.
This hands-on experience teaches students how to solve real-world problems efficiently.
Presenting and Documenting Findings
Once the model is built and tested, the final step is presenting the results clearly and understandably. This includes:
- Creating Reports: Explaining the problem, approach, and results in a structured format.
- Visualizing Data: Using graphs, charts, and dashboards to make findings more accessible.
- Explaining Insights: Making recommendations based on the data, such as how a company can reduce customer churn or increase sales.
This is an essential skill in the real world because Data Scientists must explain their findings to people who may not have technical expertise, such as business managers or investors.
16. Data Science Course Certification
A Data Science course certification is a valuable credential that validates your expertise in data analysis, machine learning, and statistical modeling. It proves your skills, making you a more attractive candidate for job opportunities in finance, healthcare, and technology.
Why Get a Data Science Certification?
- Industry Recognition: Many top companies prefer certified candidates as it assures them of your technical competence.
- Skill Validation: A certification demonstrates proficiency in Python, R, SQL, and data visualization tools like Tableau and Power BI.
- Career Advancement: Certified professionals often earn higher salaries and have better job prospects compared to non-certified peers.
- Global Opportunities: A recognized certification can help you secure roles in top international firms.
Types of Data Science Certifications
- University-Based Certifications: Offered by institutions like Harvard, MIT, and Stanford.
- Online Platform Certifications: Platforms like Coursera, edX, and Udacity offer self-paced courses.
- Industry-Recognized Certifications: Programs from Google, IBM, and Microsoft provide specialized training in AI, machine learning, and big data.
How to Choose the Right Certification?
- Check Course Syllabus: Ensure it covers data wrangling, machine learning, and data visualization.
- Accreditation: Opt for certifications from reputed organizations or universities.
- Flexibility: Choose a program that fits your schedule and learning style.
- Hands-on Projects: Certifications with real-world projects enhance practical knowledge.
17. Conclusion: The Future of Data Science
Future Scope of Data Science
Data Science is evolving rapidly, with new advancements in Artificial Intelligence (AI), the Internet of Things (IoT), and automation. As businesses continue to collect vast amounts of data, Data Science will play an even bigger role in:
- Healthcare: AI-powered diagnostics and personalized medicine.
- Finance: Automated fraud detection and risk management.
- Marketing: Hyper-personalized advertising and customer insights.
- Technology: Self-driving cars, smart assistants, and automation.
The demand for Data Science professionals is expected to grow significantly in the coming years, making it a great career choice.
Career Opportunities in Data Science
Completing a Data Science course opens the door to multiple career paths, including:
- Data Scientist: Analyzing data and building models to extract insights.
- Machine Learning Engineer: Developing AI models for automation and prediction.
- Data Analyst: Interpreting data to help businesses make better decisions.
- AI Engineer: Creating advanced AI solutions for industries.
These careers are in high demand, with excellent salaries and opportunities for growth.
Final Thoughts
Data Science is not just about crunching numbers—it’s about solving problems and making smarter decisions. A structured course with a strong syllabus ensures that learners gain the knowledge and hands-on experience needed to succeed. With dedication and practice, anyone can become a Data Scientist and make a real impact in today’s data-driven world.
If you’re considering a career in Data Science, now is the best time to start!
Data science course syllabus
FAQ’s
1. Is Data Science Course Easy?
- Data science can be both exciting and challenging, depending on your background and prior knowledge.
- If you have a solid understanding of programming, statistics, and mathematics, it might feel easier.
- However, if you’re new to these areas, the learning curve can be steep.
- The complexity increases as you dive into advanced topics like machine learning, deep learning, and big data technologies.
2. Is 3 Months Enough for Data Science?
Three months is a short time to learn data science comprehensively, especially if you’re starting from scratch. However, it can be enough for an introductory course or to build foundational skills. At this time, you can:
- Learn Python basics, data manipulation, and visualization.
- Understand core statistics and machine learning concepts.
- Complete small projects and use libraries like Pandas, NumPy, and Scikit-learn. For a deep dive and to become proficient, it’s often recommended to continue learning and practising beyond three months.
3. What Are the Subjects in Data Science?
The key subjects in data science typically include:
- Programming (e.g., Python or R)
- Statistics and Probability
- Data Manipulation and Analysis (using tools like Pandas, NumPy)
- Data Visualization (Matplotlib, Seaborn, Plotly)
- Machine Learning (Supervised and Unsupervised learning)
- Deep Learning (Neural networks, CNN, RNN)
- Natural Language Processing (NLP)
- Big Data (Hadoop, Spark)
- SQL (for data querying)
- Data Ethics and Privacy
- Time Series Analysis
4. Is Data Science Very Difficult?
- Data science can be difficult, but it’s also very rewarding. It requires a combination of skills in programming, mathematics, statistics, and domain knowledge.
- The difficulty often arises when working on real-world projects that involve unclean data, the need for advanced models, or dealing with large datasets.
- However, with the right resources, persistence, and practice, it becomes manageable.
Here are some additional frequently asked questions (FAQs) on Data Science:
5. What Skills Are Required for Data Science?
The key skills required for data science include:
- Programming (mostly Python or R)
- Mathematics and Statistics (for modelling and data analysis)
- Data Visualization (to interpret and communicate insights)
- Machine Learning (supervised and unsupervised algorithms)
- SQL (for data querying and management)
- Big Data Technologies (like Hadoop and Spark)
- Data Wrangling (cleaning and preparing data for analysis)
- Problem-solving (to identify patterns and trends in data)
- Communication Skills (to present results clearly)
6. What Are the Career Opportunities After a Data Science Course?
After completing a data science course, some common career paths include:
- Data Scientist
- Data Analyst
- Machine Learning Engineer
- Business Intelligence Analyst
- Data Engineer
- AI Researcher
- Quantitative Analyst
- Operations Research Analyst These roles are available across various industries, including tech, finance, healthcare, e-commerce, and more.
7. How Long Does It Take to Become a Data Scientist?
Becoming a data scientist typically takes anywhere from 6 months to a few years, depending on your prior experience and learning pace.
For someone with a solid background in programming and mathematics, it may take less time. For beginners, it may take longer to grasp the foundational concepts.
Continuous learning and practical experience are key to becoming proficient.
8. Do I Need a Degree to Become a Data Scientist?
9. What is the Difference Between Data Science and Data Analytics?
- Data Science is a broader field that involves extracting insights from data using advanced techniques like machine learning, predictive modeling, and big data processing.
- Data Analytics focuses more on examining historical data to uncover patterns and trends. While data analysts may use some machine learning techniques, their focus is on the interpretation and reporting of data for decision-making.
10. What Are Some Good Resources for Learning Data Science?
Some great resources for learning data science include:
- Online Courses: Coursera, edX, DataCamp, Udacity
- Books: “Python for Data Analysis” by Wes McKinney, “Hands-On Machine Learning with Scikit-Learn, Keras, and TensorFlow” by Aurélien Géron
- Websites/Blogs: Towards Data Science, Kaggle (for datasets and competitions), Analytics Vidhya
- YouTube Channels: Data School, StatQuest, Sentdex
11. Can I Learn Data Science on My Own?
Yes, it is possible to learn data science on your own.
Many people are self-taught, leveraging free resources like tutorials, online courses, books, and forums. However, it’s important to have a structured learning approach, practice with real-world projects, and keep learning continuously to build expertise.
12. What is the Salary of a Data Scientist?
Salaries for data scientists can vary depending on experience, location, and industry. On average:
- Entry-level: ₹4-8 LPA (India), $60,000-$90,000 (US)
- Mid-level: ₹8-15 LPA (India), $90,000-$120,000 (US)
- Senior-level: ₹15-30 LPA (India), $120,000-$200,000+ (US) Salaries tend to be higher in tech hubs like Silicon Valley, New York, and Bengaluru.
13. Can Data Science Be Learned Without a Strong Background in Math?
While a solid foundation in mathematics (especially statistics and linear algebra) is beneficial for data science, it is possible to start learning without advanced math skills.
Many aspects of data science, such as data wrangling, programming, and visualization, can be tackled first.
However, to move forward into machine learning and deep learning, strengthening your math knowledge will be important.
14. What is the Role of Machine Learning in Data Science?
- Machine learning is at the core of modern data science. It involves using algorithms to identify patterns in data and make predictions or decisions based on that data.
- Data scientists use machine learning to build predictive models, classification systems, recommendation engines, and much more.