
1. What Is a Snowflake Schema?
1. A Snowflake Schema is a multidimensional data warehouse model.
- It is a design approach used in data warehousing where data is organized into facts (measurable data) and dimensions (descriptive attributes).
- The Snowflake Schema is specifically used to structure dimension data in a more organized and hierarchical manner.
2. In this schema, the dimension tables are normalized.
- Normalization means breaking a large table into smaller, related tables to remove duplicate data. Instead of storing all attributes in one dimension table, the Snowflake Schema splits them into multiple tables based on logical relationships.
- For example: Instead of storing product → category → department in one table, each level becomes a separate table.
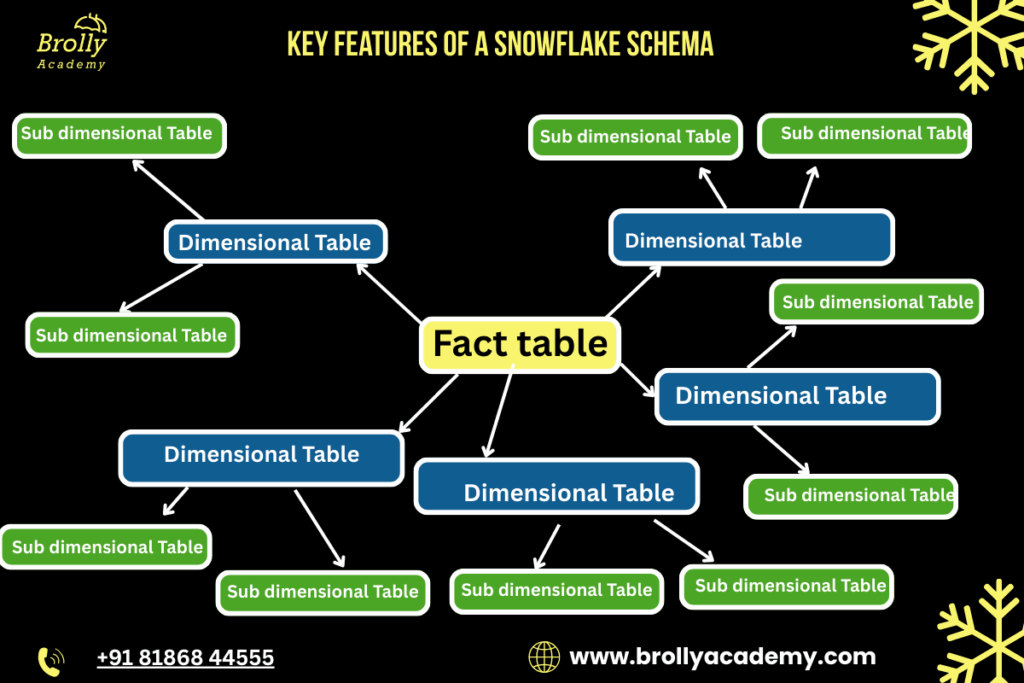
3. The structure visually resembles a snowflake.
When you draw the schema diagram:
- The central fact table is in the middle.
- Dimension tables branch out from it.
- Those dimensions further branch into sub-dimensions.
- This multi-branch design looks like a snowflake with several points.
4. It is an extension of the Star Schema.
- A Star Schema has denormalized dimension tables (one table per dimension).
- The Snowflake Schema builds on top of it by normalizing those tables.
- Thus, the Snowflake Schema adds more layers and more structure to the same dimensions.
5. Purpose of the Snowflake Schema
The Snowflake Schema is used to achieve several goals:
A.Improve data accuracy:
Because normalization removes duplicated values, every piece of information exists in only one place.
B.Maintain strong data integrity:
Updates made in one table automatically reflect across all related tables.
C.Reduce storage usage:
Splitting large tables into smaller ones avoids repeating large text fields or categories multiple times.
D.Organize data efficiently:
Complex business hierarchies (like product → brand → category → department) become easier to manage.
E.Enable detailed analysis:
Analysts can drill down through multiple levels of information.
6. Example of Normalization (Snowflaking)
Here is how normalization works in real data warehouse design:
Product Dimension Before Normalization
A single large table may contain:
- Product Name
- Category
- Subcategory
- Department
- Brand
This causes repeated values and makes the dimension table unnecessarily large.
Product Dimension After Snowflaking
The Snowflake Schema splits it into multiple tables: - Product Table – Product_ID, Product_Name, Brand_ID, Category_ID
- Category Table Category_ID, Category_Name, Subcategory_ID
- Subcategory Table-Subcategory_ID, Subcategory_Name, Department_ID
- Department Table – Department_ID, Department_NameBrand Table – Brand_ID, Brand_Name
This structure removes duplicate values and organizes data into a hierarchy.
Location Dimension Example: - City Table → State Table → Region Table
This separation allows accurate regional reporting without storing the same state or region name hundreds of times.
7. Why This Normalization Is Useful
A. Supports complex, multi-level analysis
Businesses often need to analyze data at detailed levels:
- Sales by department
- Sales by category
- Sales by subcategory
- Sales by product
The snowflake structure allows all such drill-down queries
B. Ensures high data accuracy
If a state name is spelled incorrectly in one place, you only need to fix it in the State table, not in every record across the system.
C. Improves maintenance and updates
When business categories change (new region, new department), the changes are handled easily in one table.
D. Makes the data warehouse highly scalable
As the business grows, new subcategories, regions, or departments can be added without redesigning the entire schema.
E. Reduces storage space
Cloud data warehouses charge for storage. Removing duplicate values reduces cost significantly.
8. Overall Benefit
- The Snowflake Schema provides a clean, structured, and organized model ideal for enterprise-level data warehousing.
- It reduces redundancy, enforces consistency, and supports deep analytical queries.
- Although the structure is more complex than a Star Schema, it is highly effective when data volume is large and detailed reporting is required.
2.Why the Snowflake Schema Matters in 2025 — Explained in Detail
- A decade ago, many data engineers avoided the Snowflake Schema because normalized dimension tables required multiple joins.
- On older on-premise databases, these joins caused slower query performance.
- But in 2025, cloud data warehouse technology has completely changed the situation.
- Modern cloud platforms such as Snowflake, Google BigQuery, Databricks, and AWS Redshift RA3 use massively parallel processing (MPP), columnar storage, and automatic query optimization.
- These systems can perform complex joins on billions of rows extremely efficiently.
Because of this, Snowflake Schema has become more useful and more popular. - Below is a detailed breakdown:
1. Reduced Storage Requirements
- Normalization removes repeated attributes from dimension tables.
- For example, instead of storing “State” and “Country” for every city record, these are stored once in separate tables.
- Cloud warehouses charge for both compute and storage.
- Snowflake Schema minimizes storage cost, which becomes significant for large enterprise datasets.
2. Better Data Organization
- Snowflake Schema arranges data into logical, structured layers.
- Each dimension becomes a set of smaller, related tables (city → state → country).
- This makes the data model cleaner and easier to maintain.Analysts and BI teams can understand relationships more clearly.
3. Stronger Data Quality and Consistency
- Normalization eliminates redundancy.
- Any update to a dimension attribute needs to be done only once (for example, changing a category name).
- This reduces the risk of inconsistent or duplicated data across dimension tables.Businesses relying heavily on accurate dimensions benefit greatly.
4. Enhanced Scalability for AI-Driven Analytics
- AI and machine learning workloads rely on high-quality, well-structured data.
- Snowflake Schema provides more granular, normalized attributes.
- Feature engineering becomes easier because data is cleaner and less repetitive.
- Cloud engines can join multiple tables quickly during model training.
5. Faster Performance on Modern MPP Engines
- Older systems processed queries sequentially, making joins slow.
- Modern MPP engines distribute work across many nodes.
- As a result, complex joins run efficiently even on extremely large datasets.
- This removes the historical disadvantage of the Snowflake Schema.

3. Key Features of a Snowflake Schema — Elaborated
1. Normalized Dimensions
- In a snowflake schema, each dimension table is broken down into multiple smaller tables.
- For example, instead of having all product information in one table, it may be divided into separate tables for product, category, and department.
- This structure follows relational principles and keeps data clean and well-organized.
2. Follows 3rd Normal Form (3NF)
- Snowflake schema typically aligns with the Third Normal Form, which means:
○ No redundant data is stored.
○ Each attribute depends only on the primary key. - This eliminates duplication in the dimension tables and ensures that updates or changes automatically remain consistent across the system.
3. Fact Table at the Center
- The central table is always the fact table, which contains:
○ Numerical measures (sales amount, order quantity, profit, etc.)
○ Foreign keys connecting to all related dimensions. - This table grows very large because it stores transaction-level or summary-level data.
- Dimensions are smaller and help interpret values stored in the fact table.
4. Multiple Layers of Sub-Dimensions
- Dimensions in a snowflake schema can have multiple connected tables.
Example for the Location dimension:
○ City → State → Country
- This creates a branching effect, visually similar to a snowflake.
- These layers represent real-world hierarchies more accurately.
5. Ideal for Hierarchical Data
- Industries that rely heavily on multi-level data structures benefit from this model.
- Examples include:
○ Retail (product → category → department)
○ Geography-based analytics (city → state → country)
○ Banking and finance (account → branch → region) - The schema captures these hierarchies clearly and efficiently
4. Components of a Snowflake Schema — Elaborated
A complete snowflake schema consists of several interconnected elements. Each component plays a specific role in organizing and structuring data for efficient analytics.
1. Fact Table
The fact table is the central and most important component of the snowflake schema.
It stores all the measurable, quantitative data used for reporting and analysis.
Key characteristics:
- Contains metrics such as sales amount, units sold, profit, revenue, or transaction count.
- Includes foreign keys that link to all surrounding dimension tables.
- Often grows the fastest and becomes the largest table in the data warehouse.
- Stores data at different granularities such as daily sales, order-level transactions, or monthly summaries.
Typical measures include: - Sales amount
- Units sold
- Revenue
- Discounts applied
- Number of transactions
The fact table makes analytical queries possible because it captures “what happened” in numerical form.
2. Dimension Tables
- Dimension tables provide descriptive information that helps interpret the values stored in the fact table.
- They answer the “who, what, when, where, and how” of the data.
What dimension tables store:
- Product details (name, brand, category)
- Customer information (age, gender, city)
- Date details (year, quarter, month, day)
- Location details (region, state, country)
Purpose of dimension tables:
- Add context to the facts.
- Enable filtering, grouping, and slicing data by different attributes.
- Support business-friendly reporting.
In a snowflake schema, dimension tables are often normalized, unlike in a star schema where they remain denormalized.
3. Sub-Dimension Tables
- Sub-dimensions are smaller tables created by normalizing the larger dimension tables.
- They help eliminate redundancy and improve data integrity.
Examples of sub-dimension hierarchies:
- Product hierarchy: Product → Subcategory → Category → Department
- Geographic hierarchy: City → State → Country → Region
- Time hierarchy: Day → Month → Quarter → Year
Why sub-dimensions are used:
- Reduce storage cost by removing duplicate records.
- Maintain clean, structured data with proper relationships.
- Handle complex hierarchies efficiently.
- Make updates more reliable because changes occur at only one place.
4. Hierarchical Relationships
- Snowflake schemas are especially useful when the business processes involve multi-level or hierarchical data structures.
Examples of real-world hierarchies:
- Retail: Item → Brand → Category → Division
- Sales: Salesperson → Team → Zone → Region
- Education: Course → Program → Department → University
- Geography: City → District → State → Country
Benefits of hierarchical relationships:
- More accurate modeling of real business structures.
- Easier to perform roll-up or drill-down operations in OLAP queries.
- Ideal for dashboards and analytics that require multi-level grouping.
5. Text-Based Diagram of a Snowflake Schema
A snowflake schema visually branches outward as dimensions split into sub-dimensions. The following text-based diagram represents a typical retail sales snowflake schema:
Product_Department
|
|
Product_Category
|
|Dim_Product_Category
|
|
Product
|
|
Fact_Sales_Performance
/ | \
/ | \
Customer Date Store
|
|
Store_City
|
|
Store_Region
How to Understand This Diagram
1. Central Fact Table (Sales_Fact)
The middle node Sales_Fact represents the fact table.
- It stores measurable values such as:
○ Sales amount
○ Quantity sold
○ Profit
○ Discounts - It connects to all major dimensions.
2. Product Dimension (Normalized into Multiple Layers)
The product dimension is expanded into a hierarchy with multiple sub-tables:
- Product_Department Highest-level classification (e.g., Electronics, Clothing)
- Product_Category Mid-level category (e.g., Mobiles, Laptops)
- Product_SubCategory Sub-level grouping (e.g., Android Phones)
- Product Final detailed product record (e.g., Samsung Galaxy S22)
This multi-level structure forms one branch of the snowflake.
3. Customer Dimension
- Represents descriptive details like customer name, age, gender, city, membership type, etc.
- In this simple diagram, it is not further normalized, but it could be split into:
○ Customer_Demographics
○ Customer_Location
○ Customer_Segmentation
4. Date Dimension
- The date table usually contains:
○ Day
○ Month
○ Quarter
○ Year - These can also be further normalized (optional) into:
○ Month table
○ Quarter table
○ Year table
5. Store Dimension (With Sub-Dimensions)
In this diagram, the Store dimension is normalized into multiple related tables:
- Store Base table containing store name, ID, type, etc.
- Store_City Stores information about the city the store belongs to.
- Store_Region Higher-level geographic grouping such as region, zone, or territory.
This captures real-world geography accurately.
Why This Structure Is Called a Snowflake
The diagram spreads outward from the center.
- Each dimension splits into more sub-dimensions.
- The structure looks like the branching arms of a snowflake.
- The more normalized the dimensions, the “flakier” the snowflake becomes.
6. Example of a Snowflake Schema (Real-Time Business Example)
- To understand the snowflake schema in a practical environment, let’s use a real-world scenario similar to Flipkart or Amazon.
- These companies manage millions of products, customers, locations, and transactions every day — which makes the snowflake model highly suitable.
A. Fact Table: Sales_Fact
The Sales_Fact table stores transactional, measurable business data.
Sales_Fact Table
Column Name | Description |
Order_ID | Unique ID for each order |
Product_ID | Links to Product dimension |
Customer_ID | Links to Customer dimension |
Date_ID | Links to Date dimension |
Store_ID | Links to Store dimension |
Quantity | Number of units sold |
Revenue | Total revenue generated from the sale |
This table grows continuously as new orders come in.
B. Dimension Table (Normalized): Product
Instead of storing all product attributes in one flat table, the snowflake schema divides them into multiple related tables.
Product Table
Column Name | Description |
Product_ID | Primary key |
Product_Name | Name of the product |
Category_ID | Foreign key (Category table) |
Brand_ID | Foreign key (Brand table) |
C. Sub-Dimension Tables for Product
Category Table
Column Name | Description |
Category_ID | Primary key |
Category_Name | Example: Mobiles, Laptops, Shoes |
Department_ID | Foreign key (Department table) |
Department Table
Column Name | Description |
Department_ID | Primary key |
Department_Name | Example: Electronics, Fashion, Home Appliances |
Brand Table
Column Name | Description |
Brand_ID | Primary key |
Brand_Name | Example: Samsung, Nike, Sony |
This structure ensures:
- No duplication of brand names
- Clean hierarchy
- Faster updates
D. Store Dimension (Normalized)
Store Table
Column Name | Description |
Store_ID | Primary key |
Store_Name | Warehouse or delivery center name |
City_ID | Foreign key (City table) |
City Table
Column Name | Description |
City_ID | Primary key |
City_Name | Example: Hyderabad, Mumbai |
Region_ID | Foreign key (Region table) |
Region Table
Column Name | Description |
Region_ID | Primary key |
Region_Name | Example: South India, West India |
This supports multi-level geography analysis.
E. Why This Snowflake Structure Is Important for an E-Commerce Business
A snowflake schema allows companies like Flipkart or Amazon to analyze data at multiple hierarchy levels. Some key benefits include:
1. Complex Product Analysis
E-commerce companies can easily measure:
- Sales by department
- Sales by category
- Sales by brand
- Sales by individual product
This helps identify high-performing and low-performing product lines.
2. Detailed Geographic Insights
The normalized Store → City → Region structure enables:
- City-level demand forecasting
- Region-level performance comparison
- Routing and logistics optimization
This is essential for delivery planning and improving customer experience.
3. Better Brand-Level Reporting
Brands want data such as:
- Revenue contribution
- Return rate
- Region-specific performance
- Seasonal demand trends
A snowflake schema makes this analysis straightforward
4. Reduced Storage and Higher Data Quality
Because categories, brands, cities, and regions are stored once:
- No repetition
- No redundant values
- Easy updates
- Lower storage cost on cloud systems
5. Ideal for AI & BI Analytics
Modern analytics tools require:
- Clean data
- Well-defined hierarchies
- Scalable structures
Snowflake schemas support:
- AI demand prediction
- Customer segmentation
- Inventory forecasting
- Personalized recommendations
This level of detail is crucial for modern analytics.
7. What Is Snowflaking? — Elaborated Explanation
- Snowflaking refers to restructuring dimension tables into a fully normalized form, breaking them into smaller, related sub-tables to create a more organized and detailed data warehouse schema.
- Instead of keeping all attributes inside one large dimension table, the table is split into multiple, smaller, logically related tables.
The goal of snowflaking is to:
- Reduce redundant data
- Improve data consistency
- Make hierarchies clearer
- Reduce storage usage
- Support multi-level reporting
A. Why Snowflaking Is Needed
Dimension tables in a star schema often contain repeated values. For example:
- The same category name may appear in thousands of product records
- The same brand information may be repeated for hundreds of SKUs
- The same city or region name may be repeated across many store locations
This repetition:
- Wastes storage
- Increases update effort
- Creates data quality issues
Snowflaking solves this by normalizing the data.
B. How Snowflaking Works (Step-by-Step)
Step 1: Identify Repeated Attribute Groups
Example: In a Product dimension, these may repeat:
- Category
- Brand
- Department
Step 2: Create Separate Tables
Move these repeating attributes into new tables:
- Category table
- Brand table
- Department table
Step 3: Create Foreign Key Relationships
Link the Product table to the new sub-dimensions:
- Product → Category
- Category → Department
- Product → Brand
Step 4: Remove Duplicate Values
Each value (e.g., “Electronics”) is stored once, not hundreds of times.
C. Example of Snowflaking (Before and After)
Before Snowflaking (Single Dimension Table)
Product Dimension Table (Flat Structure) Contains attributes such as:
- Product_ID
- Product_Name
- Category_Name
- Department_Name
- Brand_Name
Here, Category_Name and Brand_Name may be repeated thousands of times.
After Snowflaking (Normalized Structure)
1. Product Table
- Product_ID
- Product_Name
- Category_ID
- Brand_ID
2. Category Table
- Category_ID
- Category_Name
- Department_ID
3. Department Table
- Department_ID
- Department_Name
4. Brand Table
- Brand_ID
- Brand_Name
This structure is more efficient, clean, and scalable.
D. Advantages of Snowflaking
Eliminates duplication
- Improves data integrity
- Supports hierarchical analysis
- Reduces storage cost
- Makes updates easier and faster
- Aligns with normalization best practices
E. When Should Snowflaking Be Used?
Snowflaking is ideal when:
- A business has hierarchical data (product, geography, date)
- Data redundancy is extremely high
- There is frequent updating of dimension attributes
- Cloud storage costs matter
- BI and AI systems require clean, structured data
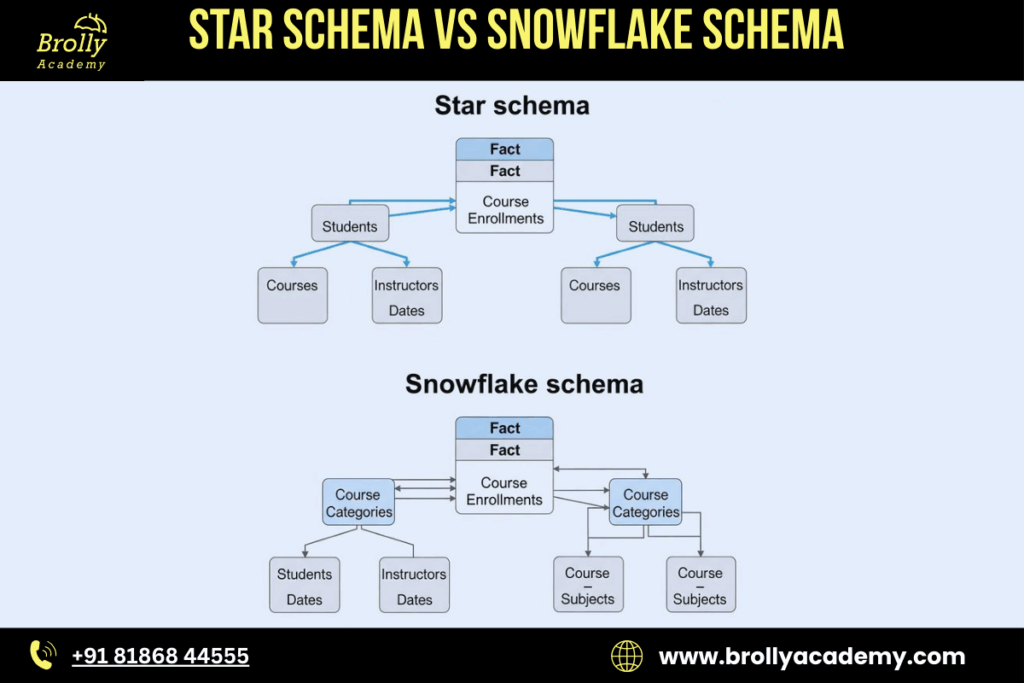
8. Star Schema vs Snowflake Schema — Deep Comparison
Star Schema
1. All dimensions are denormalized
- Dimension tables store all descriptive information in a single table.
- No sub-tables, no splitting.
- Example: A Customer Dimension contains name, address, city, state, country—all in one table.
2. Fewer joins → faster performance
- Since data is in fewer tables, queries join the fact table with flat dimension tables only.
- This reduces query complexity and improves performance.
- Ideal for dashboards, reports, and OLAP queries that need speed.
3. Very easy for BI tools
- Tools like Power BI, Tableau, Looker, Qlik understand star schema naturally.
- Lightweight structure → easy visualization → better performance.
- Best for business reporting teams.
4. Simpler to design and understand
- Star schema looks like a simple star
- The fact table is placed at the center and linked to all dimension tables.
- Business users can understand it without technical knowledge.
Snowflake Schema
1. Dimensions are normalized
- Large dimension tables are broken into multiple related tables.
- Example: Customer → City → State → Country (Each stored in separate normalized tables)
2. More joins → slightly slower
- Because dimensions are split, queries require more table joins.
- But modern cloud data warehouses (Snowflake, BigQuery, Redshift) handle these joins efficiently.
3. Saves storage
- Because data is not duplicated in dimensions, normalization avoids repetition.
- Very useful when datasets are huge (billions of rows).
4. Better for large datasets
- Cloud environments charge for storage.
- Snowflake schema reduces stored data volume by removing redundancy.
- It scales better when data dimensions grow very large.
5. Cleaner, more organized structure
- Each table contains a specific type of information, keeping data well-structured.
- Easier to maintain consistency across large, complex data models.
6. Good for complex analytical systems
- Best suited for advanced analytics where dimension relationships are detailed and hierarchical.
Real World Insights
Star Schema — Best for:
- Reporting dashboards
- Fast aggregation
- Simple business workflows
- BI tools
Why? Speed and simplicity.
Snowflake Schema-Best for:
- Complex analytical warehouses
- Environments with huge data
- Cloud-based systems (Snowflake, BigQuery, Databricks)
- Well-structured enterprise models
Why? Storage efficiency, flexibility, and scalability.
Summary Table
Feature | Star Schema | Snowflake Schema |
Dimension Tables | Denormalized | Normalized |
Number of Joins | Few | More |
Query Speed | Faster | Slightly slower |
Storage Usage | Higher | Lower |
Complexity | Simple | Complex |
Best Use-Case | Reporting & BI | Enterprise analytics |
Cloud Compatibility | Good | Excellent |
10. When Should You Use a Snowflake Schema?
- A Snowflake Schema is particularly effective in modern analytical environments where data volumes are large, hierarchies are complex, and data quality must be maintained across multiple systems.
- Below is a detailed and clear explanation of when it is the right choice.
1. When You Have Very Large Data Volumes
Add Your Heading Text Here
A snowflake schema normalizes dimension tables, which significantly reduces the overall size of the warehouse.
Why this matters:
- Large analytical databases often contain millions of records in product, customer, location, or category tables.
- Denormalized structures (star schema) repeat the same information many times.
- Normalizing the dimensions reduces table size and speeds up scanning.
Example:
An e-commerce platform storing:
- 2 million products
- Thousands of categories, brands, and subcategories
- Storing all of that in one dimension table is inefficient. Snowflaking splits them into smaller, manageable tables.
2. When You Want to Reduce Cloud Storage Costs
Cloud data warehouses charge for:
- Data stored
- Data scanned per query
- Normalized dimensions reduce duplication and therefore reduce storage and query costs.
- How snowflaking helps:
- Repeated attributes (such as category names or region names) are stored once in separate tables.
- Fact table remains lean and optimized.
- Queries on dimension filters scan fewer overall bytes.
- Cost Example:
Instead of storing “Electronics” in a Product table millions of times, you store it once in a Category table.
This reduces storage and processing cost significantly.
3. When High Data Consistency Is Required
Snowflake schema follows strict normalization rules such as 3rd Normal Form, which ensures consistency.
Advantages:
● Eliminates duplication of values.
● Reduces the chance of having inconsistent descriptions.
● Makes updates simple and centralized.
Example:
If “Telangana” is renamed or split into new administrative regions:
● In a star schema, you must update thousands of rows.
● In a snowflake schema, you update it once in the State table.
This ensures clean, reliable, and well-governed data.
4. When You Have Multi-Level Hierarchical Dimensions
Hierarchical or multi-level data naturally fits into a snowflake schema.
Examples of hierarchical structures:
● Product → Subcategory → Category → Department
● City → State → Country → Region
● Employee → Team → Department → Division
Industries that commonly use these structures:
● Retail
● Logistics
● Finance
● Manufacturing
● E-commerce
Snowflake schema organizes these relationships clearly and efficiently.
5. When Your Workload Is Analytical (OLAP) and Not Transactional (OLTP)
Snowflake schema is best suited for analytics-driven operations.
Examples of analytical tasks:
● Monthly sales trend analysis
● Multi-level category performance
● Regional forecasting
● Customer segmentation
● Brand and department comparisons
It supports complex transformations and multi-step joins required for deep business analysis.
6. When Using a Modern Cloud Data Warehouse Optimized for Joins
In older on-premise databases, snowflake schemas were avoided due to slow join performance. But modern cloud systems efficiently handle joins with MPP (Massively Parallel Processing) and query optimizers.
Platforms that handle joins extremely well:
● Snowflake
● Google BigQuery
● Databricks
● AWS Redshift RA3
● Azure Synapse
These platforms can join billions of rows in seconds, removing the traditional disadvantage of snowflake modeling.
7.Summary: When a Snowflake Schema Is the Best Choice
You should use a Snowflake Schema when:
1. You manage very large datasets.
2. You need to minimize storage and query costs.
3. High data consistency and accuracy are required.
4. Your data model has multi-level hierarchies.
5. Your system is designed for analytics, not transactions.
6. You are using a modern cloud warehouse where join performance is fast.
11. Advantages of Snowflake Schema
- A Snowflake Schema offers several technical and operational advantages, especially in modern cloud-based analytical environments.
- Its normalized structure makes it suitable for large datasets, hierarchical dimensions, and advanced analytics. Below is an in-depth explanation of each advantage.
1. High Data Integrity
Snowflake schema uses normalized dimension tables, which means each piece of information is stored only once. This significantly reduces data duplication and ensures consistency across the data warehouse.
Why this matters:
● Reduces the risk of conflicting attribute values.
● Ensures accurate reporting and analysis.
● Simplifies data updates because changes occur in one place, not in every row of a denormalized table.
Example:
If a product category name changes, updating it in one Category table automatically updates all related queries and reports.
2. Saves Storage
Because dimension tables are normalized, repeated attributes are stored separately rather than duplicated throughout the fact tables.
Benefits in cloud environments:
● Cloud storage is billed per gigabyte, so removing duplication directly reduces cost.
● Query engines scan fewer bytes, lowering compute cost on platforms like BigQuery or Snowflake.
● Smaller tables improve caching and data retrieval speed.
Example:
Instead of storing the same region name thousands of times, it is stored once in a Region table.
3. Better Organization and Manageability
Snowflake schema divides dimensions into smaller, logical components. This organization makes the data warehouse easier to maintain and much cleaner to understand.
How it helps:
● Clear separation between product, category, and department data.
● ETL/ELT pipelines become more structured.
● Easier for data engineers and analysts to track attribute relationships.
Example:
A single product dimension is broken into 4 well-structured tables:
● Product
● Category
● Subcategory
● Department
This results in a clearer and more scalable model.
4. Ideal for Multi-Level Hierarchical Data
Snowflake schema naturally represents hierarchical relationships through normalized tables.
Hierarchies commonly modeled:
● Product → Subcategory → Category → Department
● City → State → Country → Region
● Customer → Segment → Market → Territory
● Account → Sub-Ledger → Ledger → Division
Industries that benefit:
● Retail (multi-level product categorization)
● Finance (account structures)
● Healthcare (procedure → department → specialty)
● Manufacturing (material and supplier hierarchy)
The schema provides a logical and clean representation of these hierarchies, making analysis easier.
5. Highly Suitable for AI/ML and Data Science Pipelines
Machine learning and AI models require well-structured, consistent, and accurate data. The normalized structure of the snowflake schema supports these requirements.
Why it is beneficial:
● Normalized tables eliminate noisy or inconsistent attribute values.
● Hierarchical data becomes easier to extract and encode.
● Reduces chances of bias or error due to duplicated entries.
● Supports feature engineering by providing clean, well-organized attributes.
Example:
Clean location hierarchy data (city, state, region) helps in building accurate forecasting and segmentation models.
Summary: Key Advantages of Snowflake Schema
The snowflake schema is ideal when:
● Data accuracy is critical.
● Storage optimization is a priority.
● Hierarchical dimensions must be modeled properly.
● Large-scale analytics and AI tools depend on structured, clean data.
Its emphasis on organization, consistency, and scalability makes it one of the preferred modeling approaches in 2025 and beyond.
12. Disadvantages of Snowflake Schema
- While the Snowflake Schema offers strong advantages in terms of storage, consistency, and scalability, it also comes with several drawbacks.
- These limitations are important to understand before choosing this model for a data warehouse.
1. More Joins Required
Add Your Heading Text Here
Snowflake schema splits dimensions into multiple normalized tables. This means that analytical queries often require joining:
● Fact table → Dimension
● Dimension → Sub-dimension
● Sub-dimension → Higher hierarchy
Why this is a drawback:
● Queries become longer and more complex.
● More joins can reduce performance in traditional databases.
● Some analysts may struggle to write multi-join SQL efficiently.
Note for modern systems:
Cloud MPP (Massively Parallel Processing) platforms have reduced the impact, but the complexity still exists.
Add Your Heading Text Here
A snowflake schema has more tables and relationships compared to a star schema. This adds complexity at both the design and querying levels.
Challenges:
● Harder for beginners to interpret the data model.
● Requires strong understanding of normalization rules.
● ETL pipelines become more detailed and multi-step.
Impact:
New developers, BI users, or business analysts may find the data model less intuitive than a star schema.
Add Your Heading Text Here
Cloud platforms like Snowflake, BigQuery, and Redshift charge based on the computational resources used. More joins can mean:
● More compute time
● Higher data processing
● Slightly higher query costs
Reason:
Even if the performance impact is low, the engine still processes more tables and relationships, which increases compute cycles.
Examples:
● BigQuery charges per scanned data.
● Snowflake charges per compute minute. More joins can indirectly increase both.
Add Your Heading Text Here
Most business intelligence tools were originally built around the star schema model.
Examples:
● Power BI
● Tableau
● Qlik
● Looker (traditional mode)
● MicroStrategy
These tools perform better when:
● Dimensions are denormalized.
● There are fewer lookup tables.
● Data modeling is straightforward.
Why this matters:
● Dashboard performance may degrade with many joins.
● Refresh times can be longer.
● Visualizations may load slowly if the engine must resolve multiple hierarchical tables.
For most BI reporting teams, the star schema provides a smoother experience.
Summary: Key Disadvantages of Snowflake Schema
1. Requires more joins, which can complicate queries.
2. Higher model complexity than a star schema.
3. Slightly higher query costs on cloud systems due to additional compute.
4. Less friendly for BI tools, which are optimized for denormalized structures.
Despite these drawbacks, the snowflake schema remains a strong choice for large, structured, and hierarchical datasets.
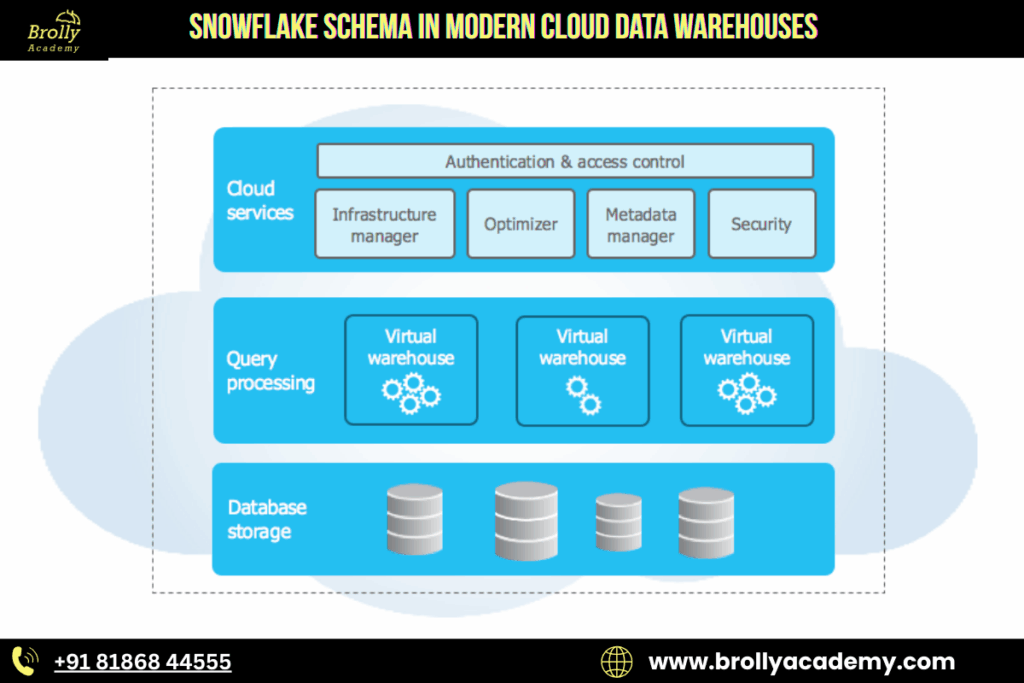
13. Snowflake Schema in Modern Cloud Data Warehouses
As of 2025, the Snowflake Schema has gained significant relevance across modern data platforms due to advancements in cloud computing, storage optimization, and AI-driven analytics. Organizations that once preferred denormalized star schemas are now revisiting snowflake modeling because many of its earlier limitations have been resolved by cloud-native technologies.
Below is a detailed explanation of why the snowflake schema has become increasingly important in 2025.
1. Cloud Storage Optimization
Cloud data warehouses charge based on storage and the amount of data scanned during queries. Normalization — the core principle of the snowflake schema — reduces duplicated values, which directly reduces storage usage.
Why this matters today:
● Cloud storage costs accumulate rapidly for large enterprises.
● Reducing table size lowers query scan costs in platforms like BigQuery and Snowflake.
● Cleaner dimension tables mean more efficient caching and compression.
Example:
A product catalog of 10 million items may repeat category or region values millions of times in a star schema. A snowflake model stores those values once, dramatically lowering storage.
This cost-efficiency makes snowflake schemas appealing for large-scale data warehouses.
2. Massive Parallel Processing (MPP)
Earlier systems struggled with multiple joins, making snowflake models slow. In 2025, cloud data warehouses use MPP technology, enabling the engine to break queries into parallel tasks.
Result:
● Joins run at very high speed.
● Query performance remains strong even with deep hierarchical structures.
● The historical disadvantage of “slow joins” is no longer a major concern.
Platforms with advanced MPP engines include:
● Snowflake
● Google BigQuery
● Databricks SQL
● AWS Redshift RA3
● Azure Synapse Analytics
These systems can execute complex multi-join queries on billions of rows in seconds.
3. AI and Machine Learning Readiness
A major trend in 2025 is the integration of data warehouses with AI and machine learning workloads.
Snowflake schemas provide:
● Clean, standardized attributes.
● Organized hierarchical relationships.
● Reduced noise and duplication.
These qualities are essential for:
● Feature engineering
● Predictive modeling
● Classification tasks
● Forecasting models
● Customer segmentation
Machine learning pipelines benefit from normalized, high-quality data because:
● Models perform better on consistent attributes.
● Data transformations become simpler.
● Redundant or conflicting values are eliminated.
In short, snowflake schemas support the structured data environment that AI systems require.
4. Automated Modeling Tools Support Snowflake Schema Natively
In 2025, modern data engineering tools automatically generate, manage, or optimize snowflake schemas.
Tools that support snowflaking out of the box:
● DBT (Data Build Tool) – modular SQL transformations
● Fivetran – automated ELT pipelines
● Informatica Cloud – enterprise ETL
● Matillion – cloud data workflow orchestration
● Airbyte – open-source ingestion
● Databricks Workflow – Delta Live Tables pipeline modeling
These tools reduce the manual effort previously required, making snowflake schemas easier to implement and maintain.
Why this is important:
● Even small teams can manage large, normalized dimension models.
● Automated lineage tracking makes relationships clear.
● Schema evolution becomes much simpler.
Automation has removed the operational burden that once made star schemas more attractive.
Summary: Why Snowflake Schema Is Highly Relevant in 2025
1. Cloud storage costs have made normalization financially beneficial.
2. MPP query engines have eliminated performance issues related to joins.
3. AI/ML workflows depend on structured, clean, hierarchical data.
4. Modern ETL and modeling tools now support snowflake schemas seamlessly.
Together, these developments make the snowflake schema one of the most practical and future-ready modeling techniques in the modern data warehouse ecosystem.
14. Snowflake Schema in AI, BI and Machine Learning (Fully Elaborated)
- In 2025, organizations are increasingly integrating their data warehouses with AI, BI, and ML workflows.
- The snowflake schema offers structural advantages that improve data quality, analytical depth, and model performance.
- Below is a detailed explanation of how snowflake modeling supports each of these areas.
A. Benefits of Snowflake Schema for AI and Machine Learning
- AI and ML models depend heavily on clean, well-structured, and high-quality data.
- A snowflake schema helps achieve this by organizing dimensions into normalized tables
1. Cleaner and More Consistent Inputs
Snowflake schemas eliminate redundancy and ensure that every attribute appears only once in the warehouse.
Advantages:
Reduces noise caused by duplicated values.
● Prevents inconsistent naming conventions across teams.
● Makes models more reliable, especially in forecasting, recommendation systems, and classification tasks.
Example:
A region name is stored in one table, ensuring accuracy across all ML features.
2. Better Feature Engineering
Feature engineering becomes more effective when data is well-organized and stored in hierarchical relationships
How snowflake modeling helps:
● Hierarchical tables allow creation of derived features, such as parent-category performance or regional groupings.
● Clean categories and attributes improve encoding quality (one-hot, label encoding, embeddings).
● Enables clear relationships between variables, which improves model interpretability.
Example:
Product → Subcategory → Category → Department hierarchy enables layered features for demand forecasting.
3. Faster Model Training Due to Reduced Redundancy
Normalized data reduces the amount of duplication that ML pipelines must process.
Benefits:
● Smaller dataset sizes reduce model load times.
● Faster iterations during training and testing.
● Lower memory consumption in ML engines.
This is important for large-scale training in platforms like Databricks, Vertex AI, and AWS SageMaker.
B. Benefits of Snowflake Schema for Business Intelligence (BI)
- A snowflake schema enables deeper and more structured analysis across different levels of detail.
- While BI tools prefer denormalized tables, snowflake structures are ideal for dashboards requiring hierarchical drill-downs.
1. Supports Deeper Drill-Down Analysis
Snowflake models naturally represent multi-level hierarchies that BI dashboards can navigate.
Examples:
● Region → State → City → Store
● Category → Subcategory → Product
● Department → Team → Employee
This allows analysts to move from high-level KPIs to granular insights easily.
Use Cases:
● Store-level sales comparison
● Regional demand forecasting
● Category-wise performance ranking
BI users gain a richer analytical experience due to detailed hierarchical relationships.
2. Enables Rich Dimensional Analysis
Multiple normalized tables allow the warehouse to store detailed metadata about each business dimension.
Benefits:
● More accurate filtering and slicing.
● Better ability to create pivot-based summaries.
● More context for trends and anomalies.
Example: A star schema may only show basic product information, while a snowflake schema includes brand, supplier, department, and category metadata.
C. Benefits of Snowflake Schema for Data Science
Data scientists require reliable, structured data to build accurate analytical pipelines. Snowflake schema offers major advantages in this context.
1. Better Segmentation Capabilities
Normalized customer or product attributes allow precise segmentation.
Examples:
● Customer → City → Region → Market classification
● Product → Subcategory → Category → Department segmentation
This helps build:
● Customer personas
● Market clusters
● Product grouping models
2. Easier Clustering
Clustering algorithms (such as K-means, DBSCAN, and hierarchical clustering) rely on structured input variables. Snowflake schema provides:
● Clean hierarchical variables
● Consistent categorical attributes
● Well-defined numerical features
This leads to more meaningful cluster formation.
3. Higher Data Consistency Across Models
Because the snowflake schema enforces strict normalization, all attributes are accurate and standardized. This reduces the risk of:
● Biased features
● Inconsistent values
● Duplicate representations of the same entity
As a result, data science pipelines become more stable and predictable.
Summary: Why Snowflake Schema Supports AI, BI and ML
1. AI/ML models benefit from clean, hierarchical, and consistent data.
2. BI dashboards gain deeper drill-down abilities and structured analytics.
3. Data science benefits from improved segmentation, clustering, and data consistency.
Together, these strengths make the snowflake schema a valuable modeling approach for organizations building modern analytical ecosystems.
15. Best Practices for Designing a Snowflake Schema
To build an efficient, scalable, and high-performance snowflake schema, follow these proven industry practices:
1. Normalize Dimensions Only When Needed
Normalization is the core idea behind a snowflake schema, but overdoing it can harm performance.
● Normalize only when there is clear redundancy.
● If a table becomes too fragmented, queries will require too many joins.
● Balance storage savings with query speed.
Example: Separate Category and Department from Product only if they are reused in many places.
2. Maintain Clear and Consistent Naming Conventions
Good naming ensures clarity across analytics, engineering, and BI teams.
● Use meaningful, descriptive names.
● Prefer prefix-based names like Product_Category, Store_Region, Customer_Segment.
● Avoid abbreviations unless widely understood.
This makes data models easier to navigate and reduces confusion during analysis.
3. Use Surrogate Keys Instead of Natural Keys
Surrogate keys (integer IDs) improve performance and prevent dependency on real-world values.
● Natural keys change over time (e.g., product codes, email IDs).
● Surrogate keys ensure stability and faster joins.
● Most modern warehouses use integer surrogate keys as best practice.
Example: Use Product_ID instead of Product_Code.
4. Create Indexes on Foreign Keys
Indexes improve join performance between fact and dimension tables.
● Essential for large datasets.
● Helps query engines quickly match dimension records.
● Reduces scan time when fact tables are massive.
In cloud warehouses, clustering or sorting keys are also recommended.
5. Use a Well-Structured Date Dimension
A powerful date dimension enables deep time-based analytics. Include attributes such as:
● Year
● Quarter
● Month
● Week
● Day
● Fiscal calendars
● Holiday flags
This supports forecasting, trend analysis, seasonal comparison, and more.
6. Partition Large Fact Tables
Partitioning breaks large fact tables into smaller segments. Benefits:
● Improves query performance.
● Reduces cost by scanning fewer partitions.
● Ideal for cloud platforms like Snowflake, BigQuery, Redshift, Databricks.
Common partition keys:
● Date_ID
● Region_ID
● Product_Category
7. Maintain Proper Documentation
Snowflake schemas can grow complex. Document:
● Table definitions
● Relationships
● Keys
● Business rules
● ETL logic
Documentation ensures smooth collaboration and maintenance.
8. Use ETL/ELT Workflows to Maintain Consistency
Ensure your pipeline maintains referential integrity.
● Validate foreign keys.
● Handle slowly changing dimensions (SCDs).
● Track changes to avoid inconsistent analytics.
Tools like DBT, Azure Data Factory, Fivetran, and Informatica simplify this process.
9. Optimize Joins for Analytics
Snowflake schemas rely heavily on joins.
● Use hash join optimization on cloud systems.
● Avoid unnecessary columns in SELECT queries.
● Keep dimension tables narrow (thin) and organized.
This helps BI tools and AI pipelines run faster.
10. Regularly Review and Refactor the Schema
As data grows, business needs change.
● Reevaluate snowflaked dimensions periodically.
● Combine tables if performance drops.
● Add new hierarchies when new analytics needs emerge.
Continuous improvement keeps the model efficient
16. Common Mistakes to Avoid
- When designing a snowflake schema, many data engineers make structural and performance-related mistakes.
- Avoiding these helps create a clean, scalable, efficient data warehouse.
1. Over-Normalization
Snowflake schema requires normalization, but too much can damage performance.
● Creating too many sub-dimension tables increases the number of joins.
● Extremely deep hierarchies slow down BI tools and analytical queries.
● Each layer adds complexity and makes debugging harder.
Best practice: Normalize only when data is duplicated significantly or used across multiple places.
Example: Do not break “Category” into 3–4 sub-levels unless business logic truly requires those levels.
2. Ignoring Fact Table Granularity
Granularity defines the lowest level of detail captured in the fact table. If it is not clearly defined, the entire warehouse becomes inconsistent.
Problems caused:
● Double counting in reports
● Incorrect filters
● Unreliable aggregations
● Complicated joins with dimension tables
Best practice: Always define granularity upfront, such as:
● One row per order
● One row per order item
● One row per customer visit
● One row per transaction event
A consistent fact table granularity ensures accurate analytics.
3. Mixing Star and Snowflake Schemas Without Logic
Many warehouses become messy because teams combine star and snowflake structures inconsistently.
Issues:
● Confusing model for analysts
● Difficult to document
● Hard to maintain and scale
● BI tools may produce unexpected results
Best practice: Hybrid models are acceptable only when planned. Use snowflake for:
● Large dimensions
● Multi-level hierarchies
Use star for:
● Small or simple dimensions
● High-performance dashboards
Always document the logic behind hybrid design.
4. Lack of Proper Indexing
Joins are the backbone of a snowflake schema. Without proper indexing, query performance collapses.
Problems caused:
● Slow query execution
● High compute costs on cloud platforms
● Longer load times for dashboards
Best practice:
● Index all foreign keys.
● Use clustering / sorting keys in cloud warehouses.
● Optimize frequently joined columns.
This ensures faster lookups and efficient join execution.
17. Performance Tuning Tips
- Snowflake schemas involve multiple normalized tables, which means query performance depends heavily on how efficiently the system handles joins, lookups, and partitions.
- The following proven strategies help improve speed, reduce compute cost, and optimize analytics workloads on cloud data warehouses
1. Use Materialized Views
Materialized views store the results of pre-joined or pre-aggregated queries. This significantly reduces query time for frequently accessed data.
How it helps:
● Minimizes the number of joins at runtime
● Speeds up dashboards
● Helps BI tools run faster
● Reduces compute cost by reusing precomputed results
Best use cases:
● Product with category and department joins
● Date hierarchy lookups
● Region → city → store lookups
Cloud platforms like Snowflake, BigQuery, Redshift, and Databricks all support materialized views.
2. Cache Lookup Tables
Small, frequently accessed dimension tables should be cached.
Benefits:
● Faster dimension retrieval
● Reduced overhead for repeated joins
● Lower network latency for distributed systems
Examples of tables to cache:
● Date dimension
● Product brand table
● Region/city table
● Customer type table
Caching is especially powerful in MPP engines where nodes repeatedly scan the same small tables.
3. Use Clustering or Partitioning
Partitioning helps the system scan only required data instead of the entire table.
Why it matters:
● Large fact tables may have billions of rows
● Partitioning by date or region improves pruning
● Query execution becomes more efficient
● Reduces compute usage and speeds up analytics
Recommended partition keys:
● Date (most commonly used)
● Region
● Store
● Category (if queries filter on it often)
Clustering on Snowflake or sorting keys on Redshift further improve performance for repeated join patterns.
4. Use Query Pruning
Modern cloud data engines automatically skip irrelevant data blocks.
Benefits:
● Faster query execution
● Lower storage scan cost
● Better dashboard responsiveness
How to enable pruning effectively:
● Partition large fact tables
● Use WHERE filters in queries
● Avoid applying functions directly on indexed columns
● Store dates in a clean format (not string manipulation)
Query pruning is essential when analyzing data over long time periods.
5. Use Surrogate Keys
Surrogate keys greatly improve join performance and ensure consistency.
Why they matter:
● Natural keys are often long strings (e.g., product names, emails)
● Surrogate keys are numeric and lightweight
● Joins become faster
● Data updates become easier
● Helps maintain slowly changing dimensions (SCD)
Example: Instead of joining on Customer_Email, use Customer_ID.
For snowflake schemas where many tables join through multiple levels, surrogate keys provide maximum optimization.
18. Industry Use Cases of Snowflake Schema
- Snowflake schema has become highly relevant in 2025 due to the rise of large-scale, cloud-native data warehouses and AI-driven analytics.
- Industries dealing with hierarchical data, multi-level reporting, and large datasets gain the most benefits from normalized dimensions.
- Below are the major industries using snowflake schema, with modern examples, data patterns, and reasons.
1. Retail (Flipkart, Amazon, Walmart, Reliance Retail)
Retail organizations handle thousands of product SKUs across multiple categories and regions. A snowflake schema is ideal because retail data is naturally hierarchical.
Typical hierarchy:
● Product
● Subcategory
● Category
● Department
Why snowflake works:
● Supports drill-down reporting like department → category → product
● Works well for assortment planning, pricing analysis, demand forecasting
● Reduces storage for repeated attributes like categories and brands
● Perfect for large SKU catalogs and omnichannel analytics
2025 relevance: Retailers are using AI-driven recommendation engines and need clean, normalized attributes for model training.
2. Finance & Banking
Banks operate with multiple account types, customer segments, and branch hierarchies.
Common hierarchy:
● Customer
● Account
● Branch
● Region
Use cases:
● Risk scoring
● Fraud detection
● Customer segmentation
● Loan portfolio analytics
● Branch performance comparison
Why snowflake works:
● High data integrity is essential in banking
● Normalization eliminates inconsistencies
● Supports precise compliance reporting (KYC, Basel III, AML, etc.)
2025 relevance: Banks are integrating cloud-native data platforms along with real-time regulatory reporting.
3. Healthcare
Healthcare data is multi-layered, sensitive, and structured around detailed hierarchies.
Typical hierarchy:
● Patient
● Diagnosis
● Treatment
● Department
Use cases:
● Clinical performance analysis
● Patient outcome optimization
● Disease prediction models
● Treatment cost analysis
● Hospital department efficiency
Why snowflake works:
● Strong normalization is required for accuracy and compliance
● Minimizes redundancy in medical classification systems (ICD, SNOMED, CPT)
2025 relevance: AI-assisted diagnostics and predictive healthcare require structured, clean data.
4. E-commerce
Large e-commerce platforms rely heavily on organized catalogs and location-based analytics.
Common hierarchy:
● Brand
● Category
● Store
● Region
Use cases:
● Sales and revenue optimization
● Category-wise performance
● Regional analytics
● Brand vs competitor comparison
● Customer behavior insights
Why snowflake works:
● Simplifies complex category trees
● Supports multi-level marketing and pricing strategies
● Works well with cloud MPP engines for faster joins
2025 relevance: E-commerce brands are using generative AI for product recommendation, dynamic pricing, and customer intelligence. Clean structured data from snowflake schema drives these systems.
5. Telecom
Telecommunication companies operate across large geographical hierarchies with millions of daily records.
Common hierarchy:
● Tower
● Region
● Zone
● Country
Use cases:
● Network performance analytics
● Call detail record (CDR) analysis
● Customer churn prediction
● Tower-level outage detection
● Region-wise capacity planning
Why snowflake works:
● Normalization scales well for millions of network entities
● Efficient for geographic hierarchies and multi-level infrastructure
2025 relevance: 5G data volumes are massive, and snowflake schema helps maintain scalable, cost-efficient storage.
6. Manufacturing
Manufacturers deal with highly structured product data and engineering hierarchies.
Typical hierarchy:
● Part
● Component
● Assembly
● Unit
Use cases:
● Bill of Materials (BOM) analysis
● Production planning
● Quality monitoring
● Machine failure prediction (IoT data)
Why snowflake works:
● BOM is naturally hierarchical
● Reduces redundancy across thousands of components
● Enables detailed analytics for cost and defect tracking
2025 relevance: Industries rely on digital twins and smart manufacturing systems, which need clean, normalized underlying data.
7. Logistics & Supply Chain
Logistics operations involve multiple transport nodes and regions.
Common hierarchy:
● Pickup zone
● City
● State
● Region
Use cases:
● Delivery time optimization
● Route planning
● Inventory distribution
● Transportation cost analysis
● Region-wise delivery performance
Why snowflake works:
● Organizes regional layers clearly
● Supports detailed geography-based analytics
● Reduces redundancy in city/state information
2025 relevance: With growing demand for hyperlocal delivery and real-time tracking, snowflake schema supports high-speed analytical pipelines.
Conclusion
- The Snowflake Schema remains one of the most relevant and powerful data modeling techniques in modern data warehousing, especially in the cloud-first analytics landscape of 2025.
- Its normalized structure helps organizations maintain cleaner data, enforce strict consistency, and manage complex hierarchies with ease.
- As businesses generate increasingly large volumes of structured and semi-structured data, the efficiency and clarity offered by a snowflake design becomes a substantial advantage.
A snowflake schema provides:
● Cleaner and more reliable data through normalization
● Higher data integrity across multiple related tables
● Well-structured hierarchical relationships for deep analytics
● Lower storage costs, which is essential in cloud environments
● Improved suitability for AI and machine learning workflows that rely on accurate, deduplicated inputs
While star schemas are still ideal for simple BI dashboards and quick insights, the snowflake schema shines when an organization needs depth, scalability, and strong data governance.
- With today’s modern cloud systems capable of performing extremely fast joins, the limitations that once held snowflake schemas back are no longer major concerns.
- In 2025 and beyond, any business working with large-scale analytics, detailed hierarchies, or AI-driven intelligence should seriously consider adopting the Snowflake Schema. When implemented correctly, it delivers long-term efficiency, accuracy, and scalability—making it a foundational choice for future-ready data platforms.
FAQs
1. Is Snowflake Schema better than Star Schema?
There is no universal “better” model; it depends entirely on use case.
Snowflake Schema is suitable when:
● You need high data consistency
● You work with multi-level hierarchies
● Storage optimization matters
● You use cloud warehouses with fast join support
Star Schema is better when:
● You need simpler, faster BI reporting
● Dimensions are small and manageable
● You prefer fewer joins
● Business users need easier query design
Summary: Snowflake offers cleaner and more structured data; star schema provides speed and simplicity. Most modern warehouses use a hybrid approach.
2. Why is it called a Snowflake Schema?
It gets its name because the normalized dimension tables branch out into multiple related sub-tables. When visualized, these branches expand outward in a pattern resembling a snowflake. This structural shape is the main reason for the term “snowflake schema.”
3. Is Snowflake Schema suitable for real-time systems?
Generally, no. Snowflake Schema is designed for analytical processing (OLAP), not transactional or real-time systems (OLTP).
Reasons it is not ideal for real-time:
● Too many joins slow down real-time requests
● Normalized tables are not optimized for streaming workloads
● Real-time systems need simpler, flatter models
Snowflake Schema is best for:
● Historical analysis
● Trend reporting
● Aggregation-based dashboards
● Machine learning pipelines
Real-time systems typically use star schemas or operational data stores (ODS).
4. Do modern cloud data warehouses prefer Snowflake Schema?
Yes. In 2025, cloud platforms like Snowflake, BigQuery, Databricks, and Redshift RA3 can perform joins extremely fast thanks to massively parallel processing (MPP).
Why cloud systems prefer snowflaked models:
● Better storage optimization
● High data integrity
● Efficient handling of hierarchical dimensions
● Structured data supports AI and ML workloads
● Lookups and joins are highly optimized
This makes snowflake schema increasingly popular in large-scale analytics environments.
5. Should beginners use Snowflake Schema?
Not initially. Beginners should start with star schema, which is easier to design, understand, and implement.
Reasons beginners should avoid snowflake schema at first:
● Higher design complexity
● More joins to manage
● Harder to maintain
● Requires deep knowledge of normalization and hierarchies
Once comfortable with data modeling principles, beginners can adopt snowflake schema for large or complex datasets where normalization adds value.
6. What is a fact table in a Snowflake Schema?
A fact table stores measurable data such as sales, orders, or transactions. It connects to dimension tables through foreign keys.
7. Why do companies use Snowflake Schema?
Companies use it to improve data integrity, reduce redundancy, and ensure clean data structures—especially in large data warehouses.
8. When should Snowflake Schema be used?
It is ideal for complex datasets that require detailed hierarchies and high data accuracy. It works best for enterprise-level analytics
9. What are the benefits of a Snowflake Schema?
It reduces redundant data, improves data quality, and enhances query accuracy. It is also more scalable for large systems.
10. What are the drawbacks of a Snowflake Schema?
Because it involves multiple joins, queries may run slightly slower. The design is also more complex and takes longer to build.
11. Does Snowflake Schema improve storage efficiency?
Yes, normalization reduces duplicate fields, which saves storage. This makes it more efficient for large datasets.
12. How does Snowflake Schema improve data integrity?
By storing data in separate related tables, changes can be made in one place and reflected everywhere. This maintains consistency.
13. Is Snowflake Schema good for BI tools?
Yes, most BI tools support Snowflake Schema structures, though performance may vary depending on query volume and complexity.
14. Does Snowflake Schema speed up queries?
Not always. It may slow down query performance due to multiple joins, but indexing can reduce this effect.
15. Is Snowflake Schema commonly used in cloud warehouses?
Yes, many cloud platforms like AWS Redshift, Google BigQuery, and Azure Synapse support this model for accuracy-focused analytics.
16. What industries benefit from Snowflake Schema?
Industries with complex hierarchical data—like e-commerce, finance, retail, and telecom—use it frequently.
17. Is Snowflake Schema suitable for small datasets?
It can be used, but it’s more beneficial for large and complex datasets. Smaller datasets may work better with a Star Schema.
18. Can Snowflake Schema reduce redundancy?
Yes, it eliminates repeated fields by placing them in normalized sub-tables.
19. What tools can be used to design a Snowflake Schema?
Tools like MySQL Workbench, Power BI, ERwin, Lucidchart, and SQL DBMS tools can design and visualize Snowflake Schemas.
20. How is hierarchy handled in Snowflake Schema?
Hierarchy is broken into multiple related tables—for example, country → state → city. Each level is independent but linked.
21. What types of relationships exist in a Snowflake Schema?
Primarily one-to-many relationships, used to connect dimensions and sub-dimensions.
22. Does Snowflake Schema support complex analytics?
Yes, its structured design helps run detailed analytical queries and hierarchical reporting.
23. Can Snowflake Schema be integrated with ETL pipelines?
Absolutely. ETL tools like Informatica, Talend, and AWS Glue easily load data into Snowflake-style structures.
24. Is Snowflake Schema better for long-term data storage?
Yes, due to reduced redundancy and high integrity, it is ideal for long-term large-scale storage.
25. Can Snowflake Schema coexist with Star Schema?
Yes, hybrid models exist where less complex dimensions use Star design and complex ones use Snowflake.
26. How does Snowflake Schema affect reporting?
It provides cleaner and more accurate reporting, especially when data hierarchy matters.
27. What skills are needed to understand a Snowflake Schema?
Knowledge of SQL, data modeling, normalization, and database relationships is helpful.
28. Is Snowflake Schema beginner-friendly?
It’s more complex than Star Schema, but easy to learn with proper examples and practice.
29. Does Snowflake Schema improve scalability?
Yes, it organizes data in a structured manner, making expansion easier without duplication.
30. Why do data engineers prefer Snowflake Schema?
Engineers prefer it for its accuracy, reduced redundancy, and clean design—especially in enterprise systems where quality matters.