Tableau Training in Hyderabad
With
Certification & 100% Placement Assistance
Classroom course | Online course | Capstone Projects | 1 Month | Flexible EMI | Free Demo Class
Looking for the best Tableau Training in Hyderabad? Our certification-focused program teaches you how to create powerful dashboards, analyse data, and work with Business Intelligence tools used in top companies. You will learn Tableau Desktop, Tableau Server, data blending, calculations, parameters, and complete real-time case studies. With expert-led sessions, beginner-friendly modules, online/offline batches, and dedicated placement assistance, we help you build the skills needed for a successful career in data analytics and visualisation.
Table of Contents
ToggleTableau Course in Hyderabad
Next Batch Details
| Trainer Name | Mr. Ravi Kiran (Certified Trainer) |
| Trainer Experience | 15+ Years |
| Next Batch Date | 26 December 2025 |
| Training Modes: | Online Training (Instructor Led) |
| Course Duration: | 30 Days |
| Call us at: | +91 81868 44555 |
| Email Us at: | brollyacademy@gmail.com |
| Demo Class Details: | ENROLL FOR FREE DEMO CLASS |
Why Brolly Academy is the Best Tableau Training Institute in Hyderabad
15+ Years
Years of expertise in Data Visualisation & BI training in Hyderabad
300+
Reviews Google ratings from learners, working professionals, and career-switchers
4.8
Rating Consistently reviewed as one of the best Tableau training institutes in Hyderabad
4,500+
Students Trained in Tableau, Power BI, and Business Intelligence courses
30 Days
Duration
Modes
Multiple Modes Online, Offline, and Hybrid Tableau classes with flexible batch timings
Fee Range
Affordable Fees EMI options, free demo sessions, and transparent Tableau course fees in Hyderabad
20+
Capstone Projects Covered across Tableau Desktop, Tableau Server, and real-time BI projects
Why Choose Brolly Academy for Tableau Training Institute in Hyderabad?
- Industry-ready Tableau analytics curriculum
- Expert trainers with 12+ yrs Tableau experience
- Hands-on projects using real business datasets
- Online & offline Tableau training options
- One-to-one placement and career guidance
- Affordable Tableau fees with EMI options
- Top Tableau training institute in Hyderabad
- Updated 2025-ready Tableau & BI curriculum
- Lifetime access to recordings & resources
- Free 3-day Tableau demo classes
- Resume, LinkedIn & interview preparation
- Tableau course with placement assistance
- WhatsApp & Discord community support
- Real-time Tableau capstone projects
- Weekday & weekend Tableau batch options
- Trusted by 4,500+ students globally
Tableau classes in Hyderabad
Tableau Course Curriculum
- What is Data,Types of Data(Structured,Unstructured,Semi Structured)
- Visualization Basics
- Different Visualization tools
- Popularity of the Tools
- Licencing Cost
- Different Products of Tableau
- Installation (Student ID)
- Connecting to Static Files
- MySQL
- Live Vs Extract
- Data Source Window
- Navigating to Work Sheet
- Data Pane,Analytics Pane
- Dimensions,Measures
- Auto Generated Fields
- Data Visualization Window Explanation
- Data Source Window Operations
- Hierarchy(In-Built Hierarchy,Manual)
- Grouping ,Sets
- Parameter With Filters and Parameter With Sets
- Usage of Meausre Names and Measure Values
- Dual Axis
- Blended Axis
- Dimension Filters
- Measure Filters(Record Level Filters,Summary Level Filters)
- Date Filters
- Cascading Filters
- Context filters
- Data Source Filters,Extract Filters.
- Quick Table Calculations
- Introduction to Calculated Fields,String Calculated Fields,Number Calculated Fields
- Date Calculated Fields
- Logical Calculated Fields,ZN Function
- Data Blending and Joins
- Mixing Up of All Calculated Fields
- Conditional Formatting in Tableau
- Data Blending,Data Joins
- Unions,Relationships
- Basic Charts and Use Cases
- Introduction to Show Me
- Development of In-Built Charts
- Customized Graphs(Donut, Waterfall,Bump,Barometer,Butterfly,Gauge meter,Basic Funnel, Advanced Funnel,Word Cloud,Gantt Bar)
- Animated Chart
- Reference Lines,Bands,Distributions
- Explaination of Marks Card
- Reference Lines
- Reference Bands
- Reference Distribution
- Forecasting
- Introduction to Dashboard
- Story Board Interfaces
- LOD’s(Fixed,Include,Exclude)
- Creating of a Basic Dashboard With Both Tiled
- Floating Layouts
- Explaination of Objects in the Dashboard Interface
- Action Filters on Dashboards
- Advanced Level Dashboard(Drill Down Dashboards),Designing of Basic Story Board
- Publishing Dashboards on Tableau Public Server
- Exposure to the Websites Which Consists of Real-Time Data
Tableau Training Roadmap – Beginner to Advanced
Tableau class Roadmap
Our Tableau Training in Hyderabad is divided into 4 simple weekly stages designed to take you from beginner to advanced level. Each week, we teach you new Tableau skills, help you understand how to work with real business data, and guide you through practical dashboards and visualisation projects. This way, you don’t just learn the theory — you actually become job-ready with hands-on, real-time Tableau experience.

01
Week 1: Tableau Basics, Data Types & Data Connections
- Introduction to Tableau and why it is a leading data visualisation tool.
- Understanding data types: structured, semi-structured, unstructured.
- Overview of Tableau products, licensing, and installation using the student edition.
- Connecting Tableau to Excel, CSV, PDF, and MySQL.
- Exploring Tableau Desktop: Data Source window, Dimensions, Measures, Data Pane, Analytics Pane.
- Working with Live and Extract connections.
- How Week 1 skills help build strong foundations similar to Data Science data exploration.
02
Week 2: Data Pane, Filters, Groups, Sets & Parameters
- Working with hierarchies, groups, sets, measure names, and measure values.
- Applying filters: dimension filters, measure filters, date filters, cascading filters, context filters, data source filters, and extract filters.
- Using dual-axis and blended-axis charts for better visuals.
- Creating interactive dashboards with parameters and filter actions.
- How Week 2 skills support tasks commonly handled by a Business Analyst.
03
Week 3: Calculated Fields, Charts & Visualisation Techniques
- Creating calculated fields: string, number, date, logical, ZN, and mixed calculations.
- Combining data using joins, unions, relationships, and data blending.
- Building essential and advanced charts: doughnut, waterfall, bump, butterfly, gauge meter, funnels, Gantt, word cloud, and animated charts.
- Using Marks Card, reference lines, bands, and distributions for formatting.
- How Week 3 develops BI skills relevant to both Tableau and MicroStrategy.
04
Week 4: LOD Expressions, Dashboards, Publishing & Placement Prep
- Learning LOD expressions: FIXED, INCLUDE, EXCLUDE.
- Designing dashboards using tiled and floating layouts.
- Adding drill-down actions, storyboards, navigation buttons, and interactive filters.
- Publishing dashboards to Tableau Public and working with real-time datasets.
- Placement prep: resume building, LinkedIn optimisation, mock interviews, and Tableau interview questions.
- Preparing for roles like Tableau Developer, Tableau Analyst, BI Analyst, and Data Visualisation Specialist.
What is Tableau?
- A Leading Data Visualization Tool: Tableau helps convert raw data into clear, interactive dashboards used across industries.
- Makes Data Easy to Understand: It shows trends and insights visually without requiring coding skills.
- Connects to Multiple Data Sources: Tableau connects with Excel, CSV, MySQL, SQL Server, Oracle, and cloud databases.
- Builds Interactive Dashboards: You can create dashboards with filters, parameters, actions, and drill-downs.
- Works for Every Industry: Businesses use Tableau for sales, marketing, finance, operations, and customer analytics.
- Advanced Analytics Support: Tableau offers calculated fields, LOD expressions, joins, unions, and forecasting.
- Beginner-Friendly Learning Path: Anyone can start and grow into roles like Tableau Developer or Business Analyst.
- Integrates With Other BI Tools: Tableau works well with SQL, Python, Power BI, and MicroStrategy for BI careers.
- Build dashboards with interactive filters and drill-down logic.
- Create charts like donut, waterfall, funnel, bump, and Gantt.
- Connect Tableau to SQL databases, MySQL, Excel, and cloud data.
- Use calculations and LOD expressions for detailed analysis.
- Publish dashboards through Tableau Public or Tableau Server.
Where is Tableau Used?
Industry | How It’s Used | Example (Optional) |
E-commerce & Retail | Tracks sales, product trends, and customer behavior using interactive dashboards. | Retail teams use Tableau to monitor daily sales and inventory. |
IT & Software | Analyzes project performance, support tickets, and operational KPIs. | IT teams use Tableau dashboards to track sprint progress. |
Healthcare | Visualizes patient data, appointments, diagnostics, and operational reports. | Hospitals use Tableau to analyze patient flow and treatment history. |
Finance & Banking | Provides dashboards for revenue, risk, fraud detection, and forecasting. | Banks use Tableau for loan analytics and fraud risk dashboards. |
Education | Tracks student performance, attendance, and learning outcomes. | EdTech platforms use Tableau for student progress dashboards. |
Marketing & Advertising | Measures campaign performance, leads, ROI, and audience insights. | Marketing teams track ad performance through Tableau dashboards. |
Media & Entertainment | Analyzes viewer engagement, content performance, and subscription data. | Media companies use Tableau for show ratings dashboards. |
Startups & Innovation | Tracks growth metrics, product usage, and customer analytics. | Startups use Tableau to monitor user acquisition and KPIs. |

Benefits of the Tableau Training Course In Hyderabad
Benefits of the Course
At Brolly Academy, we offer Tableau Training in Hyderabad both online and offline classroom modes. You can choose the learning style that fits your schedule and comfort, while still getting access to expert trainers, real-time dashboards, hands-on projects, and complete placement support.
1. Learn from Expert Tableau Trainers
Get step-by-step guidance from experienced Tableau professionals with a strong BI and analytics background.
2. Master Tableau Desktop & Server Tools
Gain hands-on experience with Tableau Desktop, Tableau Server, data connections, and visualization components.
3. Work on Real-Time Dashboards
Build practical dashboards using real datasets and business case studies.
4. Get Placement Assistance
Receive resume help, interview preparation, and job referrals for Tableau and BI roles.
5. Earn a Tableau Certification
Prepare for Tableau Desktop Specialist, Desktop Associate, and Data Analyst certifications.
6. Build a Strong Data Visualization Base
Learn charts, filters, calculations, parameters, and dashboard design essentials.
7. Follow a Complete Tableau Learning Path
Move from beginner to advanced visuals and become job-ready for Tableau Developer and Analyst roles.
8. Learn Calculations & Advanced Analytics
Practice table calculations, LOD expressions, joins, relationships, and analytics logic.
9. Create Interactive Dashboards
Build dashboards with filters, actions, drill-downs, story points, and responsive layouts.
10. Work With SQL Data Sources
Learn how to connect Tableau to SQL databases and analyse structured datasets effectively.
11. Industry-Relevant BI Skills
Gain skills used in reporting, analysis, business intelligence, and visualisation projects.
12. Beginner-Friendly for All Learners
No coding required — anyone can start learning Tableau easily.
13. Use Tableau With ETL Outputs
Understand how Tableau reads cleaned data processed through ETL tools like Informatica.
14. Visualise Cloud Data Pipelines
Learn how Tableau can be connected to cloud-processed data from Azure Data Factory.
15. Combine Tableau With ML Insights
Use Tableau to visualise predictions and results from Python-based machine learning models.
Thinking of a Tableau Training in Hyderabad?
- Traditional Training
- You sit and listen with limited interaction.
- Uses outdated slides and theory-heavy notes.
- Trainers have only basic tool knowledge.
- Minimal lab work, not much hands-on practice.
- Support ends after the classes finish.
- Small exercises with no real-world relevance.
- Little or no placement help.
- One-size-fits-all teaching.
- Brolly Academy Training
- You work on Tableau dashboards from day one.
- Covers the latest Tableau features, charts, filters, LODs, and dashboard techniques.
- Learn from experienced Tableau trainers and BI professionals.
- Daily practice with real datasets, SQL connections, and business case studies.
- Ongoing job support until you get placed in a Tableau or BI role.
- Build end-to-end Tableau projects for your portfolio.
- Resume prep, LinkedIn optimisation, and Tableau interview preparation included.
- Personalised guidance based on your career goals (Tableau Developer, Analyst, BI roles).
Best Tableau Training Institute in Hyderabad
Meet Our Tableau Trainers
INSTRUCTOR
Mr. Ravi Kiran
Tableau Developer & Business Intelligence Specialist
Experience: 10+ years in Tableau, BI, Data Visualisation & Analytics
About the tutor:
Students Trained: 4,500+ in Hyderabad
Expertise:
- Tableau Desktop, Tableau Server, Tableau Prep
- Dashboards, LOD Expressions, Calculated Fields, Data Modelling
- SQL, Data Analysis, Business Intelligence Tools
- Integrating Tableau with Excel, MySQL, Cloud Sources, and ETL Outputs
Projects:
- Sales and revenue dashboards for retail
- Financial analytics and forecasting reports
- Marketing and customer behaviour dashboards
- HR analytics, performance tracking, and operational dashboards
Teaching Style:
Simplifies Tableau concepts into practical lessons with hands-on dashboards, real datasets, and job-focused training.

Skills You’ll Gain from Tableau Training
Skills Developed after the course
- Build interactive dashboards using Tableau Desktop for real business use cases.
- Connect Tableau to Excel, CSV, SQL databases, cloud sources, and external datasets.
- Create charts such as bar, line, doughnut, funnel, waterfall, bump, and Gantt for data storytelling.
- Use filters, parameters, groups, sets, and hierarchies to build dynamic reports.
- Apply calculated fields, logical functions, date formulas, and table calculations for deeper insights.
- Work with joins, unions, blends, and relationships to combine multiple data sources.
- Use Level of Detail (LOD) expressions, including FIXED, INCLUDE, and EXCLUDE.
- Design dashboards using actions, drill-downs, tooltips, and interactive navigation.
- Format visualisations using reference lines, bands, distributions, and the Marks Card.
- Publish dashboards to Tableau Public or Tableau Server for sharing and collaboration.
- Analyse business metrics for roles like Tableau Developer, Tableau Analyst, and Business Analyst.
- Understand the complete Tableau learning path from beginner to advanced analytics.
- Work with large datasets using extracts, performance optimisation, and data source filters.
- Integrate Tableau with BI tools such as SQL, Power BI, and MicroStrategy.
- Build a strong foundation in data visualisation for real-world Tableau career opportunities.
Tableau Capstone Projects In Hyderabad Training
Tableau Capstone Projects Covered
Our Tableau course is built around real, hands-on visualisation projects so you can clearly see how Tableau is used in daily business analysis. Whether you enrol in our Tableau course, prepare for a Tableau certification, or join online/offline Tableau classes, you will gain job-ready skills for roles like Tableau Developer, Tableau Analyst, and Business Intelligence Analyst.
1. Sales Performance Dashboard
Build a complete sales dashboard using multiple charts, filters, and drill-downs to analyse revenue, product performance, regions, and customer trends—one of the most common projects in Tableau training.
2. HR Analytics Dashboard
Create dashboards to track employee performance, attrition, recruitment, attendance, and department-wise metrics, often used by HR and Business Analyst teams.
3. Marketing Campaign Analytics
Visualise campaign performance, lead generation, ROI, engagement rates, and audience behaviour using charts like funnel, waterfall, and comparative views.
4. Finance & Revenue Forecasting Dashboard
Use calculated fields, date functions, and forecasting tools to analyse cash flow, profitability, financial KPIs, and monthly/quarterly trends.
5. Operations & Supply Chain Dashboard
Build dashboards that track logistics, delivery performance, stock levels, order timelines, and inventory movement using timeline and Gantt charts.
6. Customer Insights Dashboard
Create dashboards focused on customer segmentation, demographic insights, purchase behaviour, and retention metrics.
7. Executive KPI Dashboard (CXO Dashboard)
Design a high-level dashboard with summary KPIs, visuals, filters, and interactive actions for leadership decision-making.
What Tools covered in the Tableau Course in Hyderabad
Tools Covered


Tableau Course Fees In Hyderabad
Tableau Training Fee & Offerings
Video Recording
Rs 10,00 8,000
- Lifetime access to recorded Tableau classes
- Basic to advanced modules covering charts, filters, LODs, and dashboards
- 80+ recorded lessons with real-time datasets
- 1 capstone Tableau project included
- Resume and interview preparation support
- Placement assistance included
- WhatsApp group access for doubt clearing
Class Room Training
Rs 25,000 20,000
- 2–3 months structured classroom Tableau training
- Expert Tableau trainers with real BI & analytics experience
- Real-time projects on dashboards, data blending, and business reporting
- One-on-one mentorship and lab guidance
- Monthly mock interviews and performance tracking
- Resume building & interview preparation
- Soft skills and aptitude sessions
- Dedicated placement officer for support
- Commute support for offline batches
- WhatsApp community & group access
Online Course
Rs 20,000 18,000
- Live interactive online Tableau classes (flexible timings)
- 2–3 months duration with complete modules
- Daily session recordings for revision
- Real-time project environment from Day 1
- Weekly mock interviews
- Doubt-clearing sessions with trainers
- 50+ sample dashboards and datasets
- WhatsApp group access for Q&A
Tableau Training In Hyderabad With Placement
Placement Program
At Brolly Academy, our Tableau Training program includes a full placement support system to help you learn Tableau skills, build real dashboards, and confidently apply for Tableau developer and analyst roles in top companies.

Resume Building

Placement Training

Interview Questions
Realtime Live Projects

Get Offer Letter
Scheduling Interviews

Mock Interviews

Personality Development
- Resume Building-We help you create ATS-friendly resumes highlighting Tableau dashboards, data blending, LODs, and your capstone project experience.
- Placement Training-Learn how to apply for Tableau jobs, understand job descriptions, and prepare for roles like Tableau Developer, Tableau Analyst, and BI Reporting Executive.
- Interview Questions Prep-Get access to the most commonly asked Tableau interview questions, including LODs, joins, filters, dashboard actions, and real-world use cases.
- Internships Under Experts-Gain hands-on exposure through internships guided by Tableau professionals working on real company dashboards.
- Real-Time Projects-Work on complete Tableau projects involving data cleaning, KPIs, storytelling dashboards, and client-style reporting formats.
- Aptitude Preparation-Practice analytical thinking, basic statistics, and problem-solving — essential skills for business analyst and Tableau roles.
- Personality Development-Improve communication, presentation, and confidence to present dashboards and insights in interviews and meetings.
- Mock Interviews-Attend mock Tableau interviews to strengthen real-world interview performance and build confidence.
- Scheduling Interviews-We connect you with hiring companies and schedule interviews based on your performance and job preferences.
- Get an Offer Letter-Receive job offers from companies hiring Tableau developers and analysts across various industries.
Student Testimonials – Tableau Course in Hyderabad
Tableau Student Community in Hyderabad
Student Community
Learning & Collaboration
Work together with fellow students on Tableau dashboards, share data-cleaning tips, explore charts and LODs, and solve visualisation challenges as a team.
Access to Resources and Tools
Get exclusive access to Tableau datasets, practice workbooks, project files, and recorded sessions to continue learning anytime.
Networking Opportunities
Build your professional network by connecting with Tableau trainers, BI mentors, analysts, and recruiters.
Mentorship from Industries Professional
Learn directly from Tableau specialists who guide you with project standards, dashboard design, and career advice for Tableau developer and analyst roles.
Job Support and Career Development
Stay updated with Tableau job openings, internship opportunities, freelancing projects, and placement assistance.
Prerequisites & Eligibility for Tableau Training Course In Hyderabad
Pre-requisites & Eligibility
Our Tableau Training in Hyderabad is designed for students, working professionals, and beginners who want to build or grow their careers in data visualisation and business analytics. The program is suitable for complete beginners as well as learners who have some experience working with data or reporting tools.
- Basic Computer Skills- You should know how to use a computer and manage files to follow the Tableau course smoothly.
- Excel Fundamentals-Simple Excel functions like sorting, filtering, and basic formulas help you understand Tableau data workflows.
- No Coding Knowledge Needed-Tableau Training is beginner-friendly, and you can learn Tableau without any programming background.
- Interest in Data Visualisation-A general interest in charts, dashboards, and visual storytelling makes learning Tableau easier.
- Basic Analytical Ability-Being able to read trends and compare data supports faster learning of Tableau skills.
- Students & Professionals Eligible-Anyone pursuing or completing graduation can join the Tableau course, regardless of stream.
- Basic Business Understanding-Knowing terms like KPIs or sales reports helps when working on Tableau dashboards and case studies.
- A laptop for a practice- system with moderate RAM and storage is needed to install Tableau Public or Tableau Desktop for practice.

Who Should Join Tableau Training in Hyderabad?

- Students Starting Careers: Ideal for learners aiming for data analysis, BI reporting, or Tableau developer roles.
- Professionals Upskilling: Great for working professionals shifting into analytics or improving visualisation skills.
- Freshers Seeking Jobs: Perfect for graduates wanting job-ready Tableau skills without coding.
- Business Analysts: Useful for analysts who work with reports, KPIs, and dashboards.
- Managers & Leads: Suitable for decision-makers who rely on data insights for planning.
- IT Employees: Helpful for IT teams using SQL or BI tools and adding Tableau to workflows.
- Non-Technical Learners: Best for anyone from a non-coding background looking to enter analytics.
- Freelancers & Consultants: Recommended for those offering reporting, dashboard creation, or data visualisation services.
Tableau Career Opportunities in Hyderabad
Career Opportunities
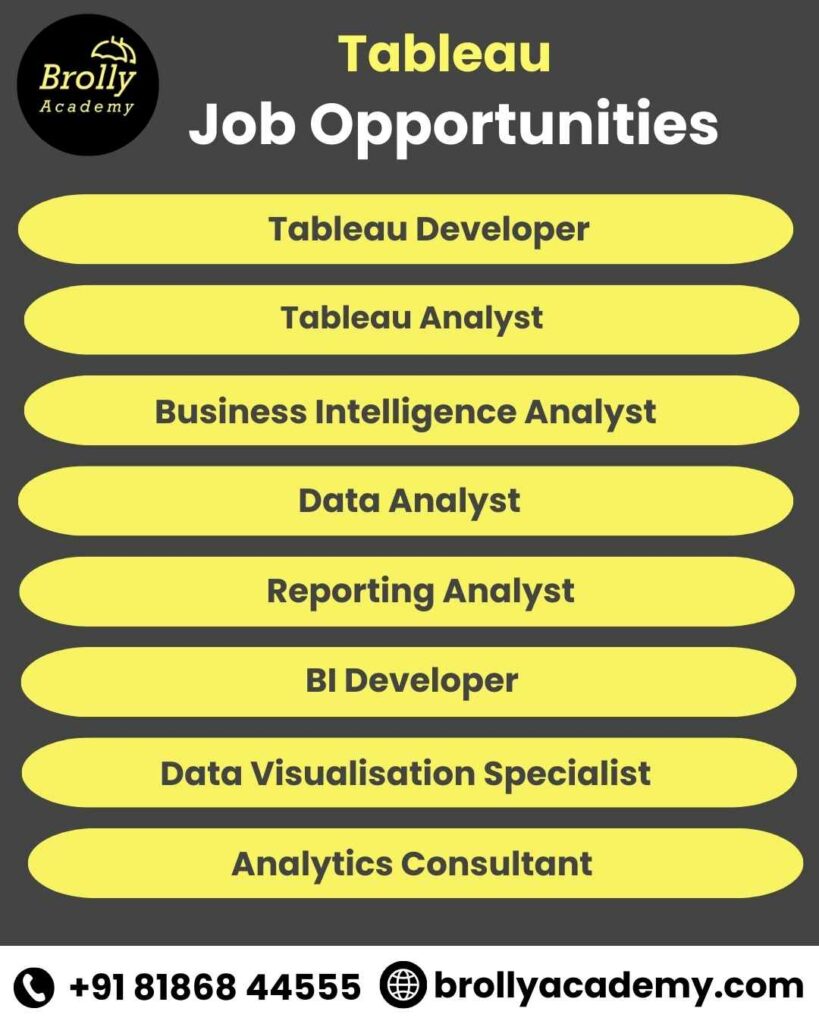
- Tableau Developer: Build dashboards, reports, and visual analytics for companies using Tableau Desktop and Tableau Server.
- Tableau Analyst: Analyse data, create insights, and support business teams with interactive Tableau dashboards.
- Business Intelligence Analyst: Use Tableau to interpret business data, track KPIs, and support decision-making across departments.
- Data Analyst: Work with SQL, Excel, and Tableau to clean data, build visual reports, and explain trends.
- Reporting Analyst: Create automated reports, scorecards, and dashboards for sales, marketing, finance, and operations teams.
- BI Developer: Develop end-to-end BI solutions using Tableau along with databases like MySQL or SQL Server.
- Data Visualisation Specialist: Design advanced charts, visual stories, and dashboards for enterprise-level reporting needs.
- Analytics Consultant: Work with clients to build Tableau dashboards, optimise reporting processes, and deliver business insights.
Over 20,000+ job openings available for Tableau in Hyderabad for freshers
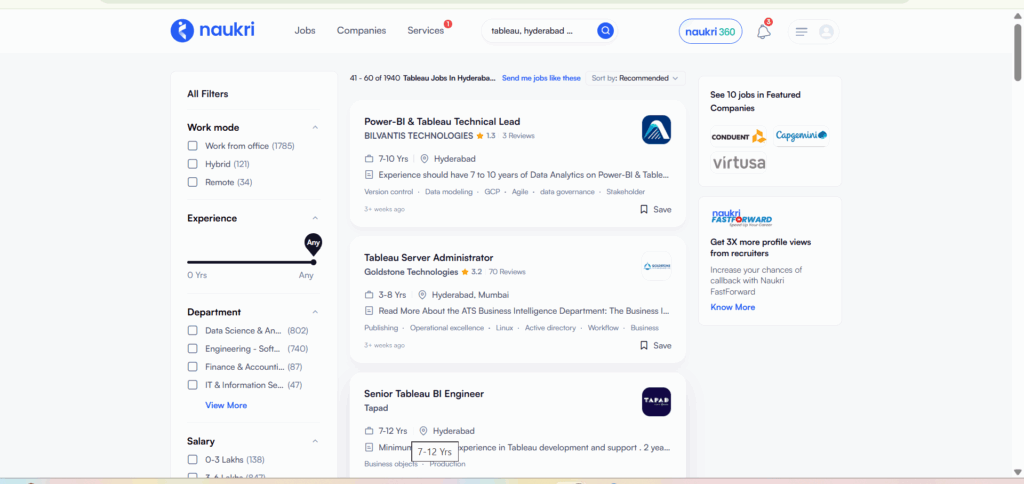
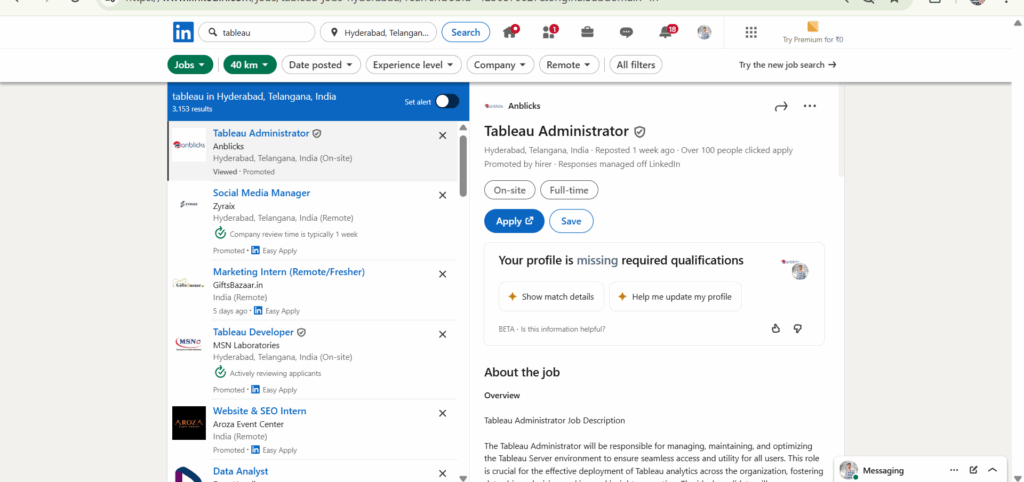
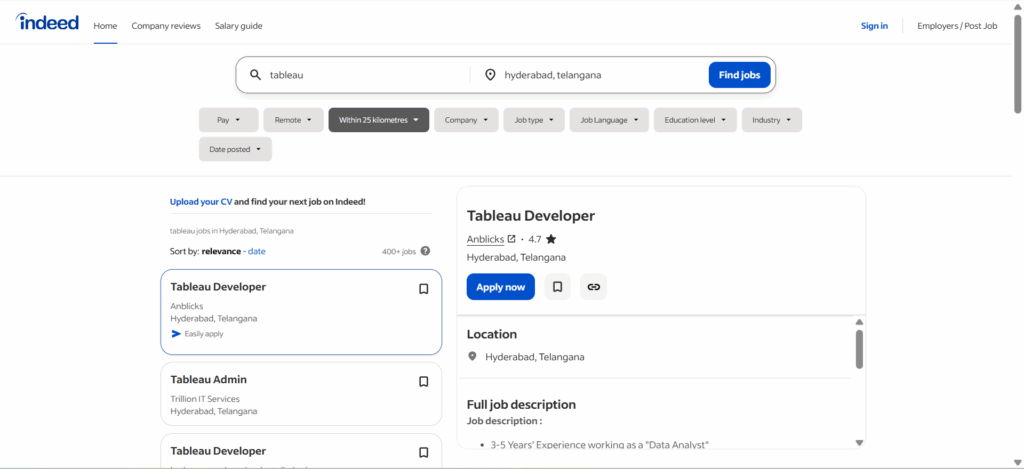
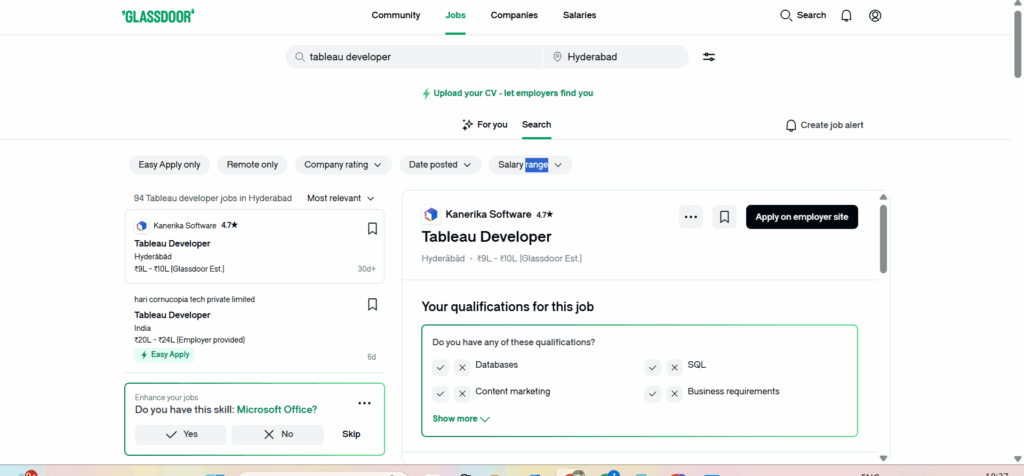
Tableau Salary in Hyderabad – Freshers to Experienced
Experience Level | Salary Range (Approx.) | Key Insights |
0–1 Years (Freshers) | ₹3.0 LPA – ₹4.5 LPA | Good for beginners with SQL + dashboard skills. |
1–3 Years (Junior Level) | ₹4.5 LPA – ₹6.5 LPA | Strong Tableau projects increase salary chances. |
3–5 Years (Mid-Level) | ₹6.5 LPA – ₹9.5 LPA | LODs, advanced charts, KPIs, and BI skills are expected. |
5–7 Years (Senior Analyst) | ₹9.5 LPA – ₹13.5 LPA | Experience with data modelling and Tableau Server adds value. |
7–10 Years (Lead Roles) | ₹13.5 LPA – ₹18 LPA | Leads manage dashboards, teams, and cross-functional BI projects. |
10+ Years (Architect / Manager) | ₹18 LPA – ₹28 LPA | High demand for BI architecture, performance tuning, and strategy skills. |
Hiring Companies for Tableau Professionals in Hyderabad


Our Achievements in Tableau Training – Brolly Academy Hyderabad
Our Achievements
60+ Tableau batches completed
10+ years of BI & Data Visualization training experience
750+ students placed in Tableau and BI roles
3,800+ students trained in Tableau & Analytics
92% placement success rate
Tableau certification training institutes in Hyderabad
These certifications help you build a strong portfolio and stand out to top hiring companies in Hyderabad and across India.
Certification of Tableau Training in Hyderabad at Brolly Academy
At Brolly Academy, every learner gets industry-recognised Tableau certifications that validate their data visualisation skills, dashboard development abilities, and real-time BI project experience. These certifications strengthen your resume and open doors to roles in Tableau development, data analysis, BI reporting, and data visualisation.
Whether you join our online or offline Tableau Training in Hyderabad, your certifications carry equal value.
- Tableau Course Completion Certificate
- Tableau Desktop Specialist Certification Preparation
- Tableau Desktop Certified Associate Certification Prep
- Tableau Certified Data Analyst Certification Prep
- Tableau Server Certified Associate Overview
- Data Visualisation & Dashboard Design Certification
- Capstone Tableau Project Certification
Market Trends – Tableau Course in Hyderabad
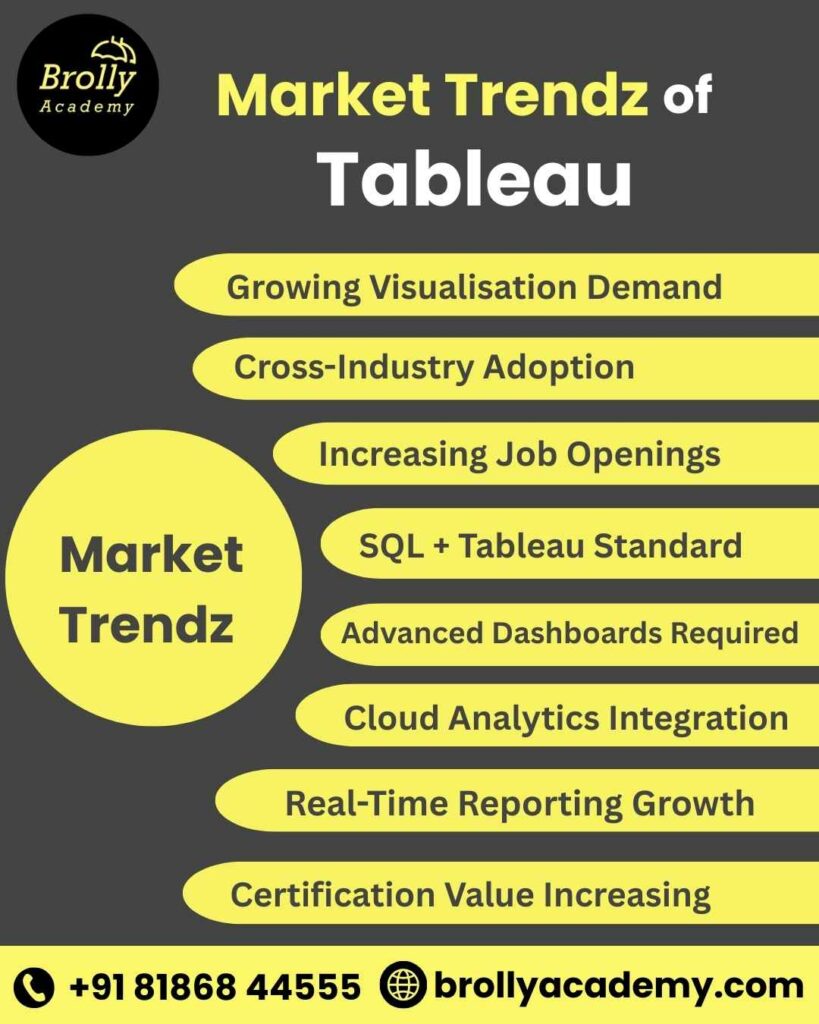
Market Trends
- Growing Visualisation Demand: Companies are adopting Tableau dashboards to make faster, data-driven business decisions.
- Cross-Industry Adoption: IT, finance, retail, healthcare, and startups use Tableau for reporting and analytics.
- Increasing Job Openings: Tableau Developer and Tableau Analyst roles continue to rise across Hyderabad.
- SQL + Tableau Standard: Most Tableau jobs now expect strong SQL skills along with dashboard development.
- Advanced Dashboards Required: Employers look for skills in LODs, KPIs, actions, and advanced chart designs.
- Cloud Analytics Integration: Tableau is widely integrated with Snowflake, AWS, Azure, and BigQuery for cloud-based BI.
- Real-Time Reporting Growth: Demand is rising for real-time dashboards using Tableau Server and scheduled refreshes.
- Certification Value Increasing: Tableau Desktop Specialist and Data Analyst certifications are now preferred by hiring teams.
Frequently Asked Questions – Tableau Training in Hyderabad
FAQS
1. What is the best Tableau training institute in Hyderabad?
Brolly Academy is considered one of the best institutes for Tableau Training in Hyderabad, with hands-on projects and placement support.
2. How much does Tableau training cost in Hyderabad?
The Tableau course fee in Hyderabad generally ranges from ₹15,000 to ₹40,000, depending on the mode and depth of training.
3. What is the syllabus for a Tableau course?
A Tableau course covers data connections, charts, filters, calculations, LODs, dashboards, and real-time projects.
4. Can I learn Tableau in 2 days?
You can learn the basics in 2 days, but full Tableau skills require structured training and practice.
5. How long does it take to learn Tableau?
Most learners take 4–6 weeks to learn Tableau with regular practice.
6. What are the job opportunities after learning Tableau?
Job roles include Tableau Developer, Tableau Analyst, Data Analyst, BI Analyst, and Reporting Analyst.
7. Is Tableau easy to learn for beginners?
Yes, Tableau is beginner-friendly because it does not require coding.
8. Which certification is best for Tableau beginners?
The Tableau Desktop Specialist certification is best for beginners.
9. What is the cost of the Tableau Desktop Specialist certification in India?
The Tableau Desktop Specialist exam typically costs around ₹7,000–₹10,000 in India.
10. Is Tableau free or paid?
Tableau Public is free, while Tableau Desktop and Tableau Server are paid versions.
11. Is Tableau in demand in India?
Yes, Tableau skills are in high demand across IT, finance, retail, and analytics companies.
12. What is the salary for a Tableau developer in Hyderabad?
A Tableau Developer in Hyderabad earns between ₹4 LPA to ₹10 LPA based on experience.
13. What skills are required to learn Tableau?
Basic Excel, analytical thinking, and an interest in data visualisation are enough to start.
14. Can I learn Tableau without coding?
Yes, Tableau does not require coding to build dashboards.
15. Which is better, Tableau or Power BI?
Both are popular, but Tableau is preferred for advanced visuals, while Power BI is preferred for Microsoft integration.
16. Is Tableau a good career for freshers?
Yes, freshers can easily start a career as a Tableau Analyst or Reporting Executive.
17. Does Tableau require SQL knowledge?
Basic SQL is helpful for data preparation, but not mandatory to start Tableau.
18. What is Tableau used for?
Tableau is used to convert raw data into charts, dashboards, and interactive reports.
19. How do I become a Tableau developer?
Learn Tableau, build dashboards, practice SQL, complete projects, and earn a certification.
20. Do you provide internships after the course?
Yes, MNCs across IT, banking, consulting, and retail use Tableau for reporting.
21. What is the duration of Tableau training in Hyderabad?
A typical Tableau training program in Hyderabad lasts 1 to 2 months.
22. Is Tableau worth learning in 2024–2025?
Yes, Tableau remains one of the top BI tools with strong job demand.
23. What is Tableau Server vs Tableau Desktop?
Tableau Desktop is for creating dashboards, while Tableau Server is for sharing and managing them.
24. Can I get a job with Tableau certification?
Yes, certifications help you get shortlisted for Tableau Developer and Analyst roles.
25. Which companies hire Tableau developers in Hyderabad?
Top companies include Accenture, Deloitte, TCS, Infosys, Tech Mahindra, and Amazon.
26. What is the fee for Tableau online training?
Online Tableau training usually costs between ₹20,000 and ₹35,000.
27. How do I prepare for Tableau certification?
Practice dashboards, learn exam topics, and solve sample questions from Tableau’s official guide.
28. What is the difference between the Tableau Desktop Specialist and Data Analyst certification?
Desktop Specialist tests basics, while Data Analyst evaluates advanced analytics and dashboard building.
29. Is Tableau good for data analysts?
Yes, Tableau is one of the most popular tools for data analysts to visualise and explain insights.
30. What is the career path for Tableau professionals?
You can grow from Tableau Analyst → BI Analyst → Tableau Developer → BI Developer → Analytics Lead.
Other Relevant Courses


Got more questions?
Talk to Our Team Directly
Contact us and our academic councellor will get in touch with you shortly.